Hands-on Tutorials
A Semantic Approach for Student Performance Prediction using Data Mining Techniques
It’s that time of the year again. Shifting through last minutes notes on the morning of the exam, devouring your breakfast like an ape to catch that final bus to the centre, reaching your designated exam room and overhearing someone discussing a topic you have no idea about and finally sitting on a bench surrounded by 30 other nervous students and writing your exam. If that pre-exam routine sounds unfamiliar to many, my apologies. But for many students before Covid-19 (remember that?) this was the way our exams went and finally based on the scores, our performance judged. But in a world where being surrounded by 30 people in a room sounds abhorrent and unheard of, where exam halls have been replaced by our drawing rooms and classrooms have never been so much missed, is there a way in which we can analyze and predict the performance of a student? Has the pandemic and its aftereffects changed how students study? And if so, in what way have they impacted the academic performance of the student?
Enter Educational Data Mining (EDM). Data Mining itself is the method of extracting patterns and drawing inferences from large and complex datasets. Put in the word Educational in front of it and it becomes about finding patterns and drawing inferences from data that comes from the education system. The Journal of Educational Data Mining defines EDM as –
"…An emerging discipline, concerned with developing methods for exploring the unique and increasingly large-scale data obtained from educational settings, and uses those methods to better understand students and the settings in which they learn"
One of the most important functions of EDM has been to predict student performance based on past activity. Now, activity can mean a lot of things and over the years many researchers have used different indicators to estimate the performance of the student. This could include looking at past CGPA scores or internal assessments, student demography (income levels, gender, school type etc.) or extracurricular activities. All these are essential indicators on which the academic performance of the student can be predicted and has been done before successfully. But what we want to know is what happens when a student is taken out of his/her traditional learning environment as what happened during the lockdown. Will these Data Mining techniques still work and accurately predict the performance of the student? And if so, what are the indicators we should use to build a workable model?
1. Dataset
One thing that becomes clear is that we need to take into account factors that reflect the learning environment of the student in these times more accurately. For this, we used the dataset of Jordanian university students as our primary dataset, which recorded responses from students in a Likert-type questionnaire form. This dataset is very useful as it not only elicits responses from students on their use of digital tools for studying but also takes into account the psychological impact caused by their excessive use, which in turn becomes a crucial factor in a student’s academic performance.
Dataset of Jordanian university students’ psychological health impacted by using e-learning tools…
Furthermore, taking inspiration from the above-mentioned survey we also created a google form link and distributed it to undergraduate students belonging to various Indian colleges. The form also asked similar questions to students along with their demographic information like age, level/year, gender and GPA(just like in the Jordanian dataset) and was then added to our primary dataset. As both datasets were compiled way after the lockdown was announced, students were already in a habit of using digital tools for studying.
A small subset of the actual dataset is given below –
With more than 801 rows, I think we are ready to go.
2. Data Preparation
Right of the bat, we notice a lot of values in the need of being translated for the machine to understand them. Out of the 30 feature columns, 22 are survey entries based on the Likert scale, 1 is a binary column (gender) and the rest are entries based on different categorical values, including our target value (GPA). In order to make the data machine-interpretable we covert the following values into numerical or binary values –
- Converting all Likert responses into numerical values (‘Strongly Disagree’:0, ‘Disagree’:1, ‘Strongly Agree’:4,’Uncertain’:2, ‘Agree’:3)
- Performing One-Hot Encoding for all categorical features.
- And label encoding for our target value (GPA : ‘Below 60 / Below 2.0′:0, ’60–69 / 2–2.49′:1, ’70–79 / 2.5–299′:2, ’80–89 / 3–3.49’:3, ‘+90 / +3.5’:4) and Hour values (‘3–6’:1, ‘6–9’:2, ‘9–12’:3, ‘+12’:4, ‘1–3’:0).
- As there are only 4 rows with GPA below 2.0, we remove them.
-
After removing all the NaN values we are left with 781 rows and 46 columns. Finally, I have our cleaned data set as shown below:
3.EDA and Feature Selection

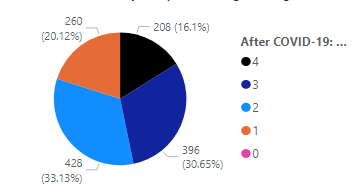
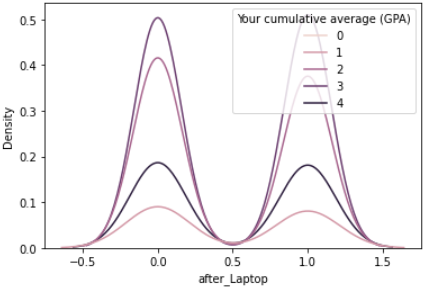
As expected there is a stark contrast in the time spent using digital tools for learning before and after covid. The percentage of students using digital tools for more than 3–6 hours increased by 22.6% while those using it for more than 9–12 hours increased by 16.6%. But what’s more interesting is to see the effect of this change on the students GPA scores. To understand this we use Kernel Density Estimation (KDE) which can be defined as follows –
In statistics, kernel density estimation is a non-parametric way to estimate the probability density function of a random variable.
We can basically interpret it as the measure of probability density or likelihood of an event happening based on a particular value.

In the above graph, we see students had a better chance of getting a higher CGPA if they spent more than 1–3 hours on digital tools for learning after the pandemic. However, in both curves, excessive use of online learning tools leads to a steady decline in academic performance. Thus, intuitively we can say that the excessive use of digital tools may harm the student’s academic performance. More on this later.
Moving on, in order to prevent overfitting in our model, it is imperative that we perform feature selection. Now, we can reduce columns based on 2 principles –
- If the feature itself has little correlation with our target value.
- Or when two features are highly correlated with one another we keep only one feature in order to reduce variance in our test dataset.
For this, we can use a correlation heatmap or a KDE plot. E.g-
4. SMOTE
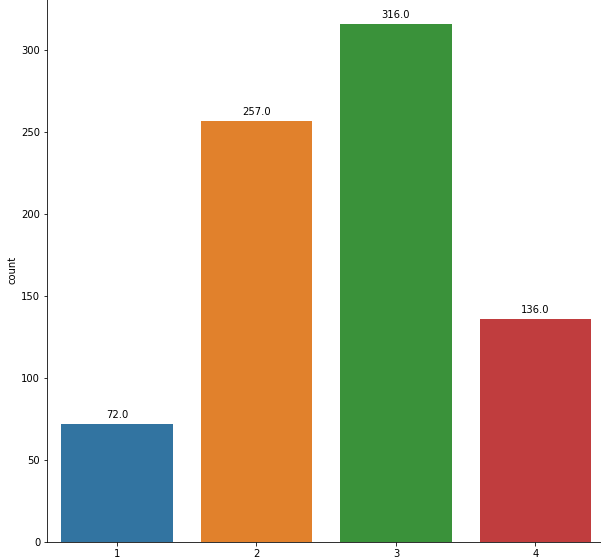
Before we move onto model selection we need to take into account the prevalent class imbalance in our dataset. The challenge of working with imbalanced datasets is that most Machine Learning techniques will ignore, and in turn have poor performance on, the minority class, although typically it is performance on the minority class that is most important. To solve this we use Synthetic Minority Oversampling Technique or SMOTE. The basic explanation of SMOTE is that it will overpopulate the minority class by synthesizing new examples by selecting those that are close to its feature space. Or simply, it will generate new rows for the class that is under-represented in our dataset.
5. Model Selection
Before identifying the classification model that is the most predictive for the dataset, we split the data into a test and train set by the ratio of 0.33. After that, we used 5 data mining techniques based on their effectiveness as described in previous papers for student performance prediction –
- Support Vector Machine
- Decision Tree
- Random Forests
- k-Nearest Neighbors
- Artificial Neural Network
In order to evaluate the model, we use ‘Accuracy’ as our scoring metric, which gives us the number of correctly predicted data points out of all the data points.

6. Conclusion
When we started this project, there were 2 questions we wanted to answer –
- Can we use non-traditional indicators that reflect the current situation in order to predict the performance of the student?
- How has the pandemic and the subsequent lockdown affected the academic lives of students?
To answer the first question, we see that all the classification techniques give us decent performance with ANN being the most accurate. Hence, it’s possible that we can even further improve our model which may give us even better results.
Now, to answer the second question, take a look at the table below –
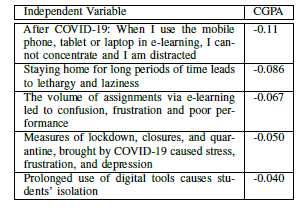
These are some of the questions that were asked in the form and their corresponding coefficient value with GPA. What this table basically tells us that students who agreed with the above questions had a higher chance of getting a lower GPA score. This goes hand in hand with the figure we found while performing EDA that 72.5% of students did not recommend continuing with the online learning model because ‘it is socially and psychologically unhealthy’. So, according to this study, we can conclude that the effect of the pandemic not only had a negative impact on the psychological health of the students but also had a detrimental impact on their academic performance as well.
Finally, I hope this model can act as a reference for anyone interested in studying the effects of the Covid-19 and the subsequent measures that were imposed on students and educational institutes.
Here is the link to my GitHub, which contains the code and dataset used for this project.


