
Concrete and step-by-step analysis
In this blog, I will describe how the monitoring frequency would affect the Death Rate of the prescription Opioids overdose. The specific process includes background introduction, literature review, empirical model, data exploration, empirical result, future tests, and Conclusions and Policy Implications, and citation.
Introduction
Prescription Opioids are usually used to treat acute pain as an important component of treatment. However, the misuse and overdose of opioids have been a growing problem throughout the United States in recent years.
Every day, approximately 174 people will die from drug overdoses(Jalal, Hawre, et al 2018). Currently, opioids, including prescription opioids, heroin, and synthetic opioids such as fentanyl and its chemical analogs, are the leading cause of overdose deaths(Jalal, Hawre, et al 2018).

Under such conditions, the system dynamics model shows that the opioid overdose crisis is expected to worsen – with the annual number of opioid overdose deaths projected to reach nearly 82, 000 by 2025(Chen, Qiushi, et al 2019). Thus, the U.S. government decided to establish Prescription Drug Monitoring Programs (PDMPs) to combat the harsh condition. Currently, every 1‐point increase in monitoring strength was associated with a 1% reduction in overdose deaths(Pardo, Bryce., et al 2017).
As a result of the above, we can conclude from the growing death trend that there are plenty of patients and drug abusers who cannot control themselves overdoes on the prescription opioids because they might not able to control themselves and lack critical information about the harm of overdose. Therefore, having better Prescription Drug Monitoring Programs (PDMPs) is necessary to intervene in these people’s myopic behaviors to lower the unnecessarily high death rate for the opioids overdose for policymakers.
Literature Review
In the literature review section, I will present four opioids overdose-related literature in chronological order to show how the effect of prescription drug monitor programs on prescription opioids overdose death rates change over time.
The first piece of literature quantifies the relation of Prescription Drug Monitoring Programs (PDMPs) to drug overdose death rate at the state level. It indicates that while PDMPs are potentially an important tool to prevent the illegal use of prescribed substances, their impact is not reflected in the drug overdose death rate (Paulozzi, Leonard J., et al 2011). Their effect on the consumption of prescribed opioids appears to be small. PDMP managers need to develop methods to improve the use of their data to affect the problem of prescription drug overdoses death rate (Paulozzi, Leonard J., et al 2011).
The second literature pointed out that in order to reduce the gradually increasing prescription opioids overdose death rate, forty-nine states (all but Missouri) created prescription drug monitoring programs to help monitor high-risk prescribing drugs (Patrick, Stephen W., et al 2016). It also found that a state’s implementation of a program was associated with a reduction of 1.12 opioid-related overdose deaths on average per 100,000 population in the year after implementation (Patrick, Stephen W., et al 2016).
The third literature used a more accurate and wider range of data from the Centers for Disease Control and Prevention’s (CDC’s) Online Data for Epidemiologic Research database (WONDER) to regress state–year death rates on an index variable compiled from the Prescription Drug Abuse Policy System (PDAPS) (Pardo, Bryce., et al 2017). From the data, the literature points out that monitoring strength was associated negatively with overdose death rate. Every 1‐point increase in monitoring strength was associated with a 1% reduction in overdose death rate (Pardo, Bryce., et al 2017).
The most recent study explored whether states have transitioned across PDMP models over time. It presented that since 1999, US states have tended to transition to more robust classes of prescription drug monitoring programs (Smith, Nathan, et al 2018).
From all the literature reviews above, we should have realized that the effect of prescription drug monitoring programs on prescription opioids overdose death rates is gradually growing stronger. However, none of the literature had put opioids overdose death rate among other important influential factors into one single empirical model to indicate how the prescription opioids overdose death rate is affected by other important factors.
Therefore, for further study, I will investigate more deeply the relationship between prescription opioid overdose death rate per 100,000 population and monitor frequency along with other factors to realize the importance of controlling prescription opioids abuse. Our independent variable of interest is the prescription opioids monitor frequency. I will use the state as our unit of analysis and collect data at the state level.
Empirical Model
Linear regression is used to estimate the relationship between prescription opioids overdose death and monitor frequency. In this paper, we will estimate the following regression model:
OverdoseDeath= B0 + B1 MonitorFrequency + B2 Uninsured + B3Income+ B4Region + B5Race + B6Education + B7*Marijuana Legalization+ error
In the model above, the overdose death variable measures prescription opioids overdose death rate per 100,000 population by state. Our independent variable of interest is monitor frequency which measures the monitor frequency of prescription drugs for each state.
Income variables include the median income for each state and the proportion of the population 4 that falls below the federal poverty line. The uninsured variable measures the proportion of the total state population without health insurance. We also count the regions, the northeast is excluded. The race includes the percentage of black people who are African Americans and the percentage of white people who are non-Hispanic per state. Education measures the percentage of high school graduate rate per state. And marijuana legalization measures if the state is fully legalized or not.
Data Exploration
Prescription opioids overdose death rate data was obtained from the Kaiser Family Foundation analysis of Centers for Disease Control and Prevention (CDC), National Center for Health Statistics in 2014.
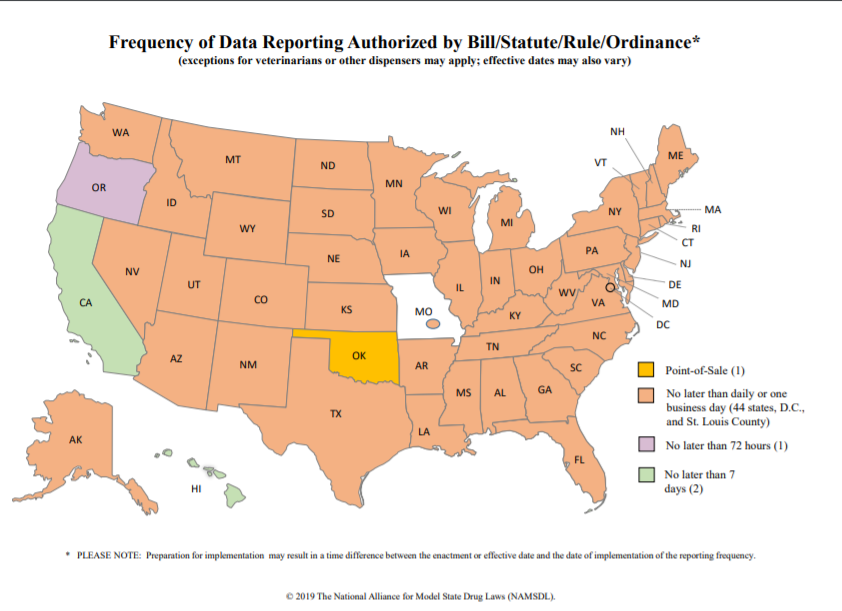
Independent variables are based on 2014–2015 publicly available state-level data. Data sources for monitor frequency are based on the Frequency of Prescription Drug Monitoring Program (PMP) Data Reporting – Map above. Independent variable defines monitor frequency as the frequency of prescription drug updates in each state. There are three types of frequency: daily, three days period, and weekly.
State characteristics include poverty rate (percent of the population at or below poverty), annual median income, the proportion of the state population that is uninsured, and race. All state characteristics were obtained for 2016 from the Kaiser Family Foundations.
Education includes the percentage of high school graduates per state. And the data were obtained from the U.S. Census Bureau, 2013–2017 American Community Survey 5-Year Estimates.
Marijuana Legalization measures if the state is fully legalized or not. And the data were obtained from the Map of Marijuana Legalization per State in April 2019.

Table 1 above shows a wide variance in prescription opioids overdose death rate across states from 27 people per year in North Dakota to 1449 in California with an average of 370.45. Monitor Frequency in the United States varied from daily check-in in 44 states, D.C., and St. Louis County to weekly in California and Hawaii.
Empirical Results
Regression results in Table 2 below show that monitor frequency is an important factor to determine state prescription opioids overdose death rate. A higher frequency of updates leads to a lower overdose death rate. When monitor update becomes more frequent by one day, state opioids overdose death will decrease by 70.78 (p-value

Other important factors of prescription opioids overdose death rate include poverty, percentage of high school graduates. Since state median income gives a relatively small coefficient, we are not able to use it to conclude anything. Although state median income is not statistically significant, higher poverty rates accompany lower prescription opioids overdose death rates (p<0.001). Since the three regions, insurance, marijuana legalization, whites, and blacks all have relatively high p-value, we are not able to use them to conclude anything.
Future Tests
Throughout this study, we have had multiple assumptions of errors within the residuals that we now must test for to further reinforce our results. These assumptions are normal residuals, no heteroskedasticity, no multicollinearity, and no omitted variables. Having normal residuals is important to the overall study because it allows for valid hypothesis testing. More specifically, normality ensures that our p-values, t-tests, and f tests are reasonable and justifiable. To test for this normality assumption, the Skewness-Kurtosis All Normality Test is used.

By analyzing the dependent variable, overdose death rate, we see that its p-value for skewness is lower than 0.001 and does not pass the test. Therefore, this must be corrected for future regression run with ln(overdoes death rate).
VIF Test
The next test checks for any multicollinearity within the model which is when a perfect linear relationship exists between more than two of the variables. This would lead to coefficients and standard errors being unstable and inflated.
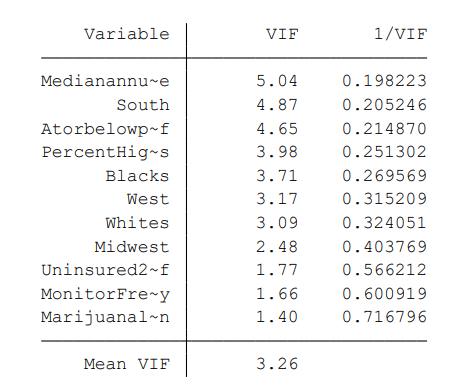
If a variable has a VIF greater than 10, it could be considered as a linear combination of other independent variables, however, all variables in this model pass the test. There is no apparent multicollinearity in the variables.
Breusch-Pagan Test
To test for heteroskedasticity, which means the residuals have unequal spread, we will use the Breusch-Pagan Tests.
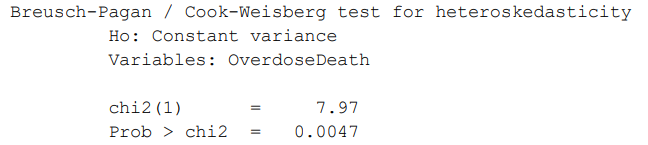
In this test, the p-value is actually lower than 0.005. Therefore we would conclude that the null(constant variance a.k.a homoskedasticity) is rejected and there is likely heteroskedasticity in the residuals.
Ramsey Test
The final test, the Ramsey test, analyzes whether or not non-linear combinations of the fitted values help explain the dependent variable. If they do, that means the model may be incorrectly specified.
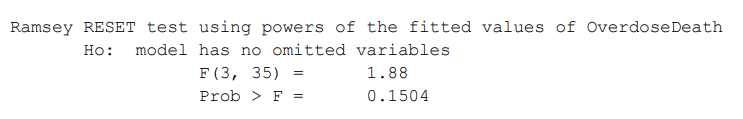
Fortunately, the p-value is bigger than 0.1. So the model likely not has a variable being omitted and is adequate according to the test.
To correct the heteroskedasticity and normality issues shown in the Breusch-Pagan, and Skewness/Kurtosis tests, we will run a regression with the natural log of the dependent variable, ln(Overdoes death rate). This regression also utilizes robust standard errors which further combats the conditional heteroskedasticity in the residuals.

Conclusions and Policy Implications
Empirical results demonstrate that higher monitor frequency will lower the prescription opioids overdose death rate. As mentioned before, previous literature indicates that every 1‐point increase in monitoring strength was associated with a 1% reduction in overdose death rate (Pardo, Bryce., et al 2017). Therefore, increasing monitor frequency should be considered an important target for public health officials and policymakers as a potential means of reversing the increasing trend of prescription opioids overdose death rate nationwide. Such policy interventions may include help insurers and prescription drug monitoring programs to better can identify and take action to reduce both inappropriate and illegal prescribing, limit third-party payers to reimbursement in ways that reduce inappropriate prescribing, discourage efforts to obtain prescription opioids from multiple healthcare providers, and improve clinical care. Our empirical results also support the view that family welfare policies for the households that fall below the poverty line threshold could result in a good return in reduced prescription opioids overdose death rate.
The results of this study are not without limitations. First, all data on overdose death rate by the state were self-reported which could lead to error and bias results. Second, different states would have a different number of medical stores which gives more access for people to get prescription opioids compared to those states that have a smaller amount of medical stores. Finally, we did not take the economic budget of each state as a factor into account. These richer states can put more money into the local welfare and medical system that helps to lower the prescription opioids overdose death rate. Further issues concerning the residuals were discussed and corrected in the last regression.
Citations
Chen, Qiushi, et al 2019. "Prevention of Prescription Opioid Misuse and Projected Overdose Deaths in the United States." JAMA Network Open, vol. 2, no. 2.
"Frequency of Prescription Drug Monitoring Program (PMP) Data Reporting – Map." NAMSDL, 2019 National Alliance for Model State Drug Laws (NAMSDL), 2 Jan. 2019.
Jalal, Hawre, et al 2018. "Changing Dynamics of the Drug Overdose Epidemic in the United States from 1979 through 2016." Science, vol. 361, no. 6408, 2018.
"Map of Marijuana Legality by State." DISA Global Solutions, 25 Apr. 2019.
Pardo, Bryce., et al 2017. "Do More Robust Prescription Drug Monitoring Programs Reduce Prescription Opioid Overdose?" Addiction, vol. 112, no. 10.
Patrick, Stephen W., et al 2016. "Implementation Of Prescription Drug Monitoring Programs Associated With Reductions In Opioid-Related Death Rates." Health Affairs, vol. 35, no. 7.
Paulozzi, Leonard J., et al 2011. "Prescription Drug Monitoring Programs and Death Rates from Drug Overdose." Pain Medicine, vol. 12, no. 5.
"Prescription Opioid Overdose Deaths and Death Rate per 100,000 Population (Age-Adjusted)." The Henry J. Kaiser Family Foundation, 16 Jan. 2019.
Smith, Nathan, et al 2018. "A Typology of Prescription Drug Monitoring Programs: a Latent Transition Analysis of the Evolution of Programs from 1999 to 2016." Addiction, vol. 114, no. 2.


