Often neglected in the implementations of the most popular Machine Learning and statistical analysis frameworks is survival analysis. Simply, survival analysis is the time it takes for an event of interest to occur. Although that seems pretty straight forward, the reality is a little more complicated. In this article, we will go through some of the high level concepts necessary to understand when conducting survival analysis, or deciding if it is the right tool for your problem.
What problems does survival analysis solve?
As you may have guessed by the name, Survival analysis has historically been employed by the medical research community to measure the survival rate on certain drugs or treatments for various conditions. This is far from its only use, as it is also commonly used in business. You can use survival analysis to predict when one of your current customers will stop using your service (churn), or when a machine you made will break (failure-time analysis). Sociologists use survival analysis to predict the occurrence and timing of events (event-history analysis).
You might be asking yourself "aren’t there other tools, such as regression or classification, that can solve this problem?". The answer is, no. The reason? Censoring.
Censoring
Censored subjects are those which have not experienced the event of interest within the observation window. Let’s pretend that we are researchers sent to the Ogasawara Islands to study the survival of the native snail populations, against the ship rats (Rattus rattus)that infest the islands. Studies show that the increase in ship rat populations on the islands has led to a decline in the land snail species (specifically, snails with larger shells that live above-ground/on trees). We arrive at the island, with enough funding and supplies to observe the larger, above-ground snails for 1 month.

In our example, let’s pretend we can observe 500 of the above mentioned ground snails when they enter our observation zone, which is a 1-acre portion of land in the forest. When the snails enter this zone, we can observe them. We also magically have a lot of data on the snails, features such as: shell diameter, weight, time spent in trees, time spent on the ground. Now we will sit, and wait to document our snail friends who get eaten by the rats, or live to tell the tale.
After one month, we have recorded all of the times snails were eaten by rats, but our funding has run out and we have to go. All of the snails which we have observed throughout the month and are B: still alive or C: left the observation area, are considered right censored. The event of interest (their death) has not occurred within the observation period.
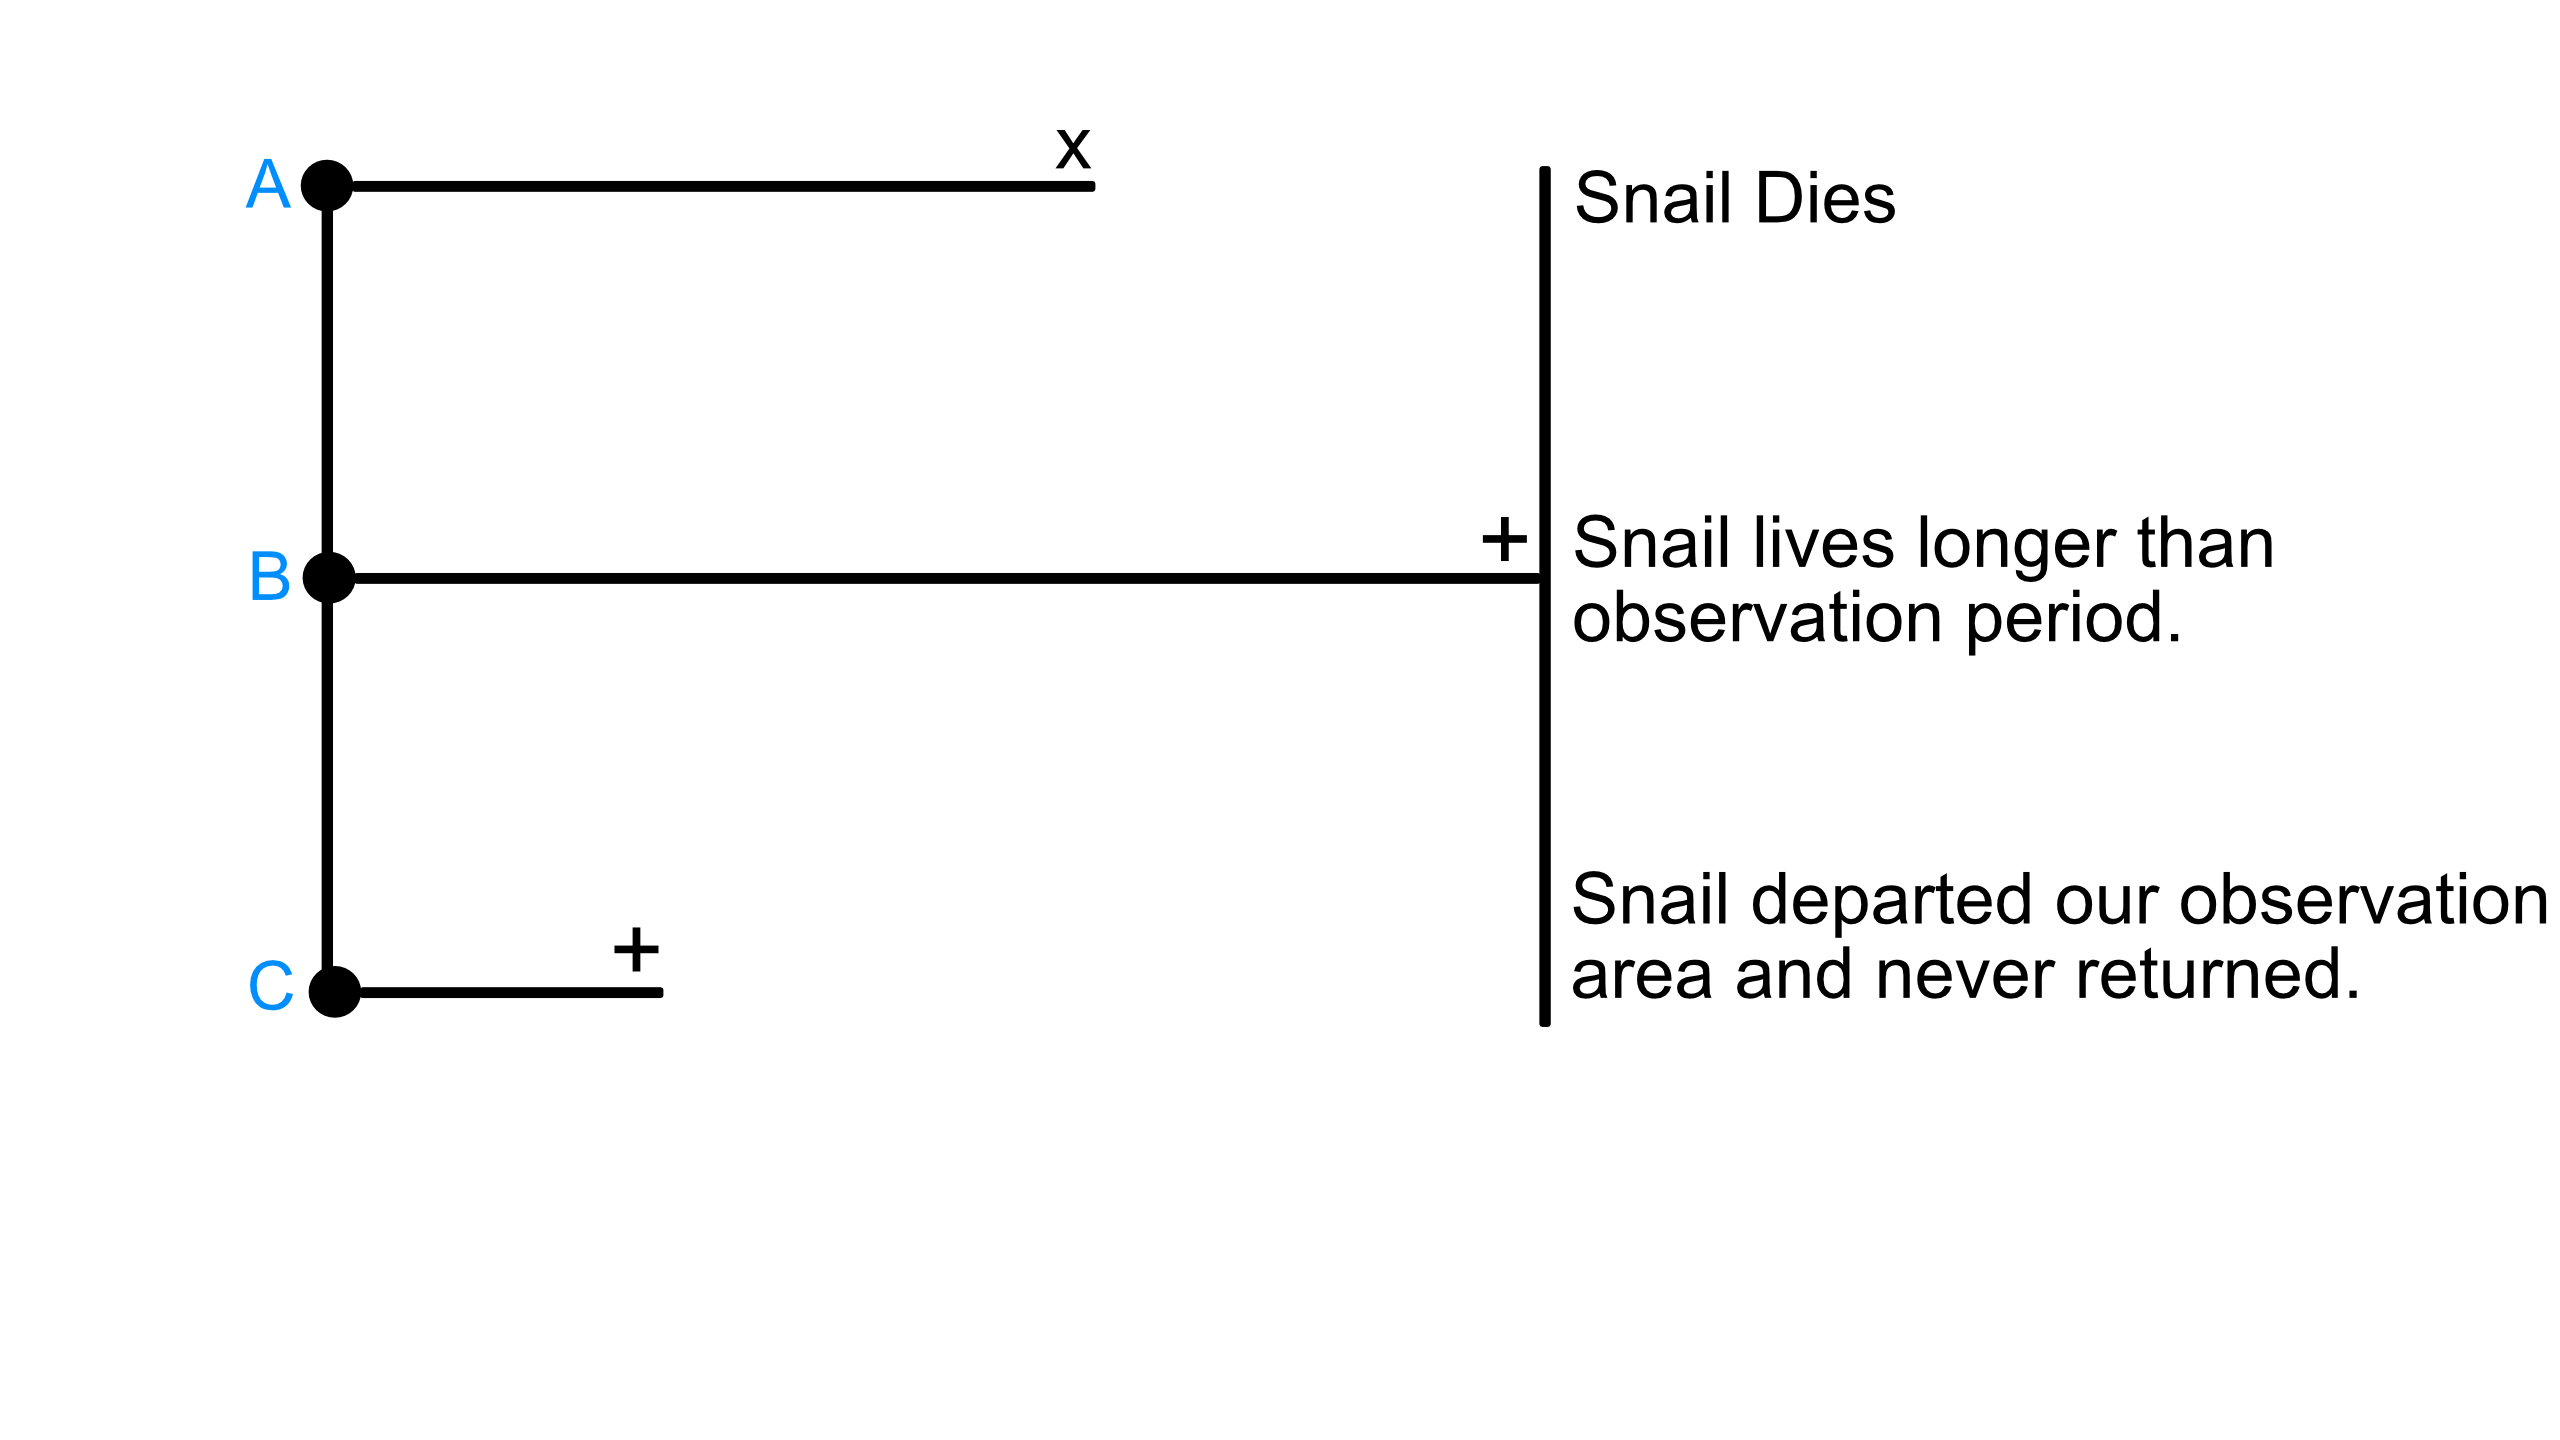
Right censoring is the most common type of censoring, and also the only one that makes sense in our snail example. With traditional classification and regression models, all of the observation falling into category B and C would have to be discarded. With survival analysis, we can use all of the observations to predict the probability of an event happening at a particular time.
Survival and Hazard functions.

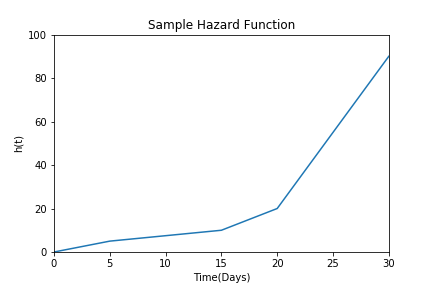
Survival functions S(t), are usually represented with the time on the x-axis, and the probability of an event occurring on the y-axis. If the blue line in the above graph were flat, staying close to 100% as the days went on, then that would be good news for the snails – it means many survive across the observation period. However, in the above example (fictional data was used for the graph) we can see a gradual decline in survival followed by a steep decline on day 20. This suggests poor survival for the snails.
The hazard h(t), is the probability that a snail who is under observation at time t has an "event" (is killed by rats) at that time. The only difference between the survival function and the hazard function is that the former is focused on not having the event and the latter is focused on the event occurring.
Conclusion
When all is said and done, the outlook for the poor snails on the Ogasawara Islands is bleak at best. But with survival analysis, we are able to predict the times of a snails demise with greater effectiveness than other methods. This is just scratching the surface of a very complicated subject, but it’s good to have a grasp of these foundational concepts before moving on to the harder stuff. In the future, I plan to dig a little deeper and implement some survival analysis models with pysurvival.
Until then, happy coding!
💻 Feel free to check out my website.
Sources:


