
It is no longer difficult to understand what people think about a topic by analysing the tweets shared by people. Sentiment analysis is one of the most popular use cases for NLP (Natural Language Processing).
In this post, I am going to use "Tweepy," which is an easy-to-use Python library for accessing the Twitter API. You need to have a Twitter developer account and sample codes to do this analysis. You can find the Jupyter Notebook code in my Github Repository.
The aim of this post is to analyse what people think about the second lockdown in London.
Step 1: Install and Import Libraries
Before analysis, you need to install textblob and tweepy libraries using !pip install command on your Jupyter Notebook.
# Install Libraries
!pip install textblob
!pip install tweepy
You need to import libraries that you will use in this Sentiment Analysis project.
# Import Librariesfrom textblob import TextBlob
import sys
import tweepy
import matplotlib.pyplot as plt
import pandas as pd
import numpy as np
import os
import nltk
import pycountry
import re
import stringfrom wordcloud import WordCloud, STOPWORDS
from PIL import Image
from nltk.sentiment.vader import SentimentIntensityAnalyzer
from langdetect import detect
from nltk.stem import SnowballStemmer
from nltk.sentiment.vader import SentimentIntensityAnalyzer
from sklearn.feature_extraction.text import CountVectorizerTweepy supports both OAuth 1a (application-user) and OAuth 2 (application-only) authentication. Authentication is handled by the tweepy.AuthHandler class.
OAuth 2 is a method of authentication where an application makes API requests without the user context. Use this method if you just need read-only access to public information.
You first register our client application and acquire a consumer key and secret. Then you create an AppAuthHandler instance, passing in our consumer key and secret.
Before the authentication, you need to have Twitter Developer Account. If you don’t have, you can apply by using this link. Getting Twitter developer account usually takes a day or two, or sometimes more, for your application to be reviewed by Twitter.
Step 2: Authentication for Twitter API
# Authentication
consumerKey = "Type your consumer key here"
consumerSecret = "Type your consumer secret here"
accessToken = "Type your accedd token here"
accessTokenSecret = "Type your access token secret here"
auth = tweepy.OAuthHandler(consumerKey, consumerSecret)
auth.set_access_token(accessToken, accessTokenSecret)
api = tweepy.API(auth)After your authentication, you need to use tweepy to get text and use Textblob to calculate positive, negative, neutral, polarity and compound parameters from the text.
Step 3: Getting Tweets With Keyword or Hashtag
#Sentiment Analysisdef percentage(part,whole):
return 100 * float(part)/float(whole)keyword = input("Please enter keyword or hashtag to search: ")
noOfTweet = int(input ("Please enter how many tweets to analyze: "))tweets = tweepy.Cursor(api.search, q=keyword).items(noOfTweet)
positive = 0
negative = 0
neutral = 0
polarity = 0
tweet_list = []
neutral_list = []
negative_list = []
positive_list = []for tweet in tweets:
#print(tweet.text)
tweet_list.append(tweet.text)
analysis = TextBlob(tweet.text)
score = SentimentIntensityAnalyzer().polarity_scores(tweet.text)
neg = score['neg']
neu = score['neu']
pos = score['pos']
comp = score['compound']
polarity += analysis.sentiment.polarity
if neg > pos:
negative_list.append(tweet.text)
negative += 1elif pos > neg:
positive_list.append(tweet.text)
positive += 1
elif pos == neg:
neutral_list.append(tweet.text)
neutral += 1positive = percentage(positive, noOfTweet)
negative = percentage(negative, noOfTweet)
neutral = percentage(neutral, noOfTweet)
polarity = percentage(polarity, noOfTweet)
positive = format(positive, '.1f')
negative = format(negative, '.1f')
neutral = format(neutral, '.1f')The scenario in this post like that, the user should type keyword or hashtag (lockdown2 london) and type how many tweets (2500) that want to get and analyse.
The number of tweets parameter is important because of the limit.

After getting 2500 tweets about "lockdown2 london", let’s have a look number of tweets that which sentiments
#Number of Tweets (Total, Positive, Negative, Neutral)tweet_list = pd.DataFrame(tweet_list)
neutral_list = pd.DataFrame(neutral_list)
negative_list = pd.DataFrame(negative_list)
positive_list = pd.DataFrame(positive_list)
print("total number: ",len(tweet_list))
print("positive number: ",len(positive_list))
print("negative number: ", len(negative_list))
print("neutral number: ",len(neutral_list))You could get 2500 tweets and;
- 1025 (41.0%) of tweets include positive sentiment
- 580 (23.2%) of tweets include negative sentiment
- 895 (35.8%) of tweets include neutral sentiment
#Creating PieCartlabels = ['Positive ['+str(positive)+'%]' , 'Neutral ['+str(neutral)+'%]','Negative ['+str(negative)+'%]']
sizes = [positive, neutral, negative]
colors = ['yellowgreen', 'blue','red']
patches, texts = plt.pie(sizes,colors=colors, startangle=90)
plt.style.use('default')
plt.legend(labels)
plt.title("Sentiment Analysis Result for keyword= "+keyword+"" )
plt.axis('equal')
plt.show()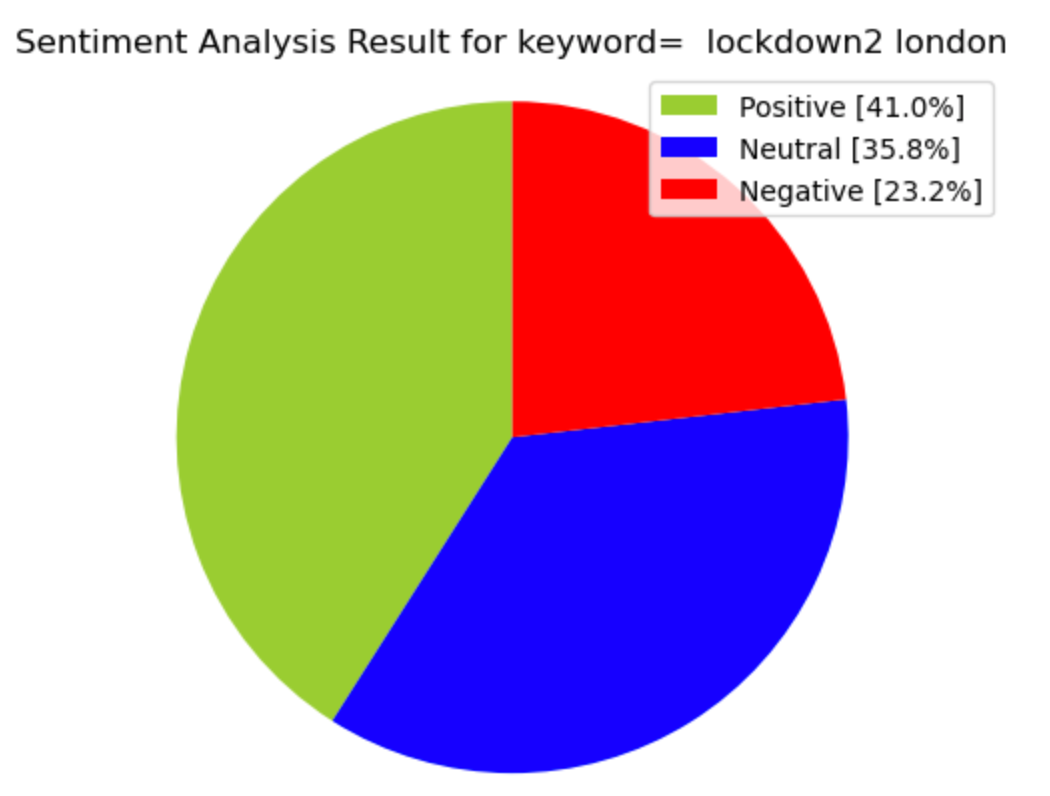
Let’s have a look tweet list.
tweet_list
Step 4: Cleaning Tweets to Analyse Sentiment
When you have a look tweet list you can see some duplicated tweets, so you need to drop duplicates records using drop_duplicates function.
tweet_list.drop_duplicates(inplace = True)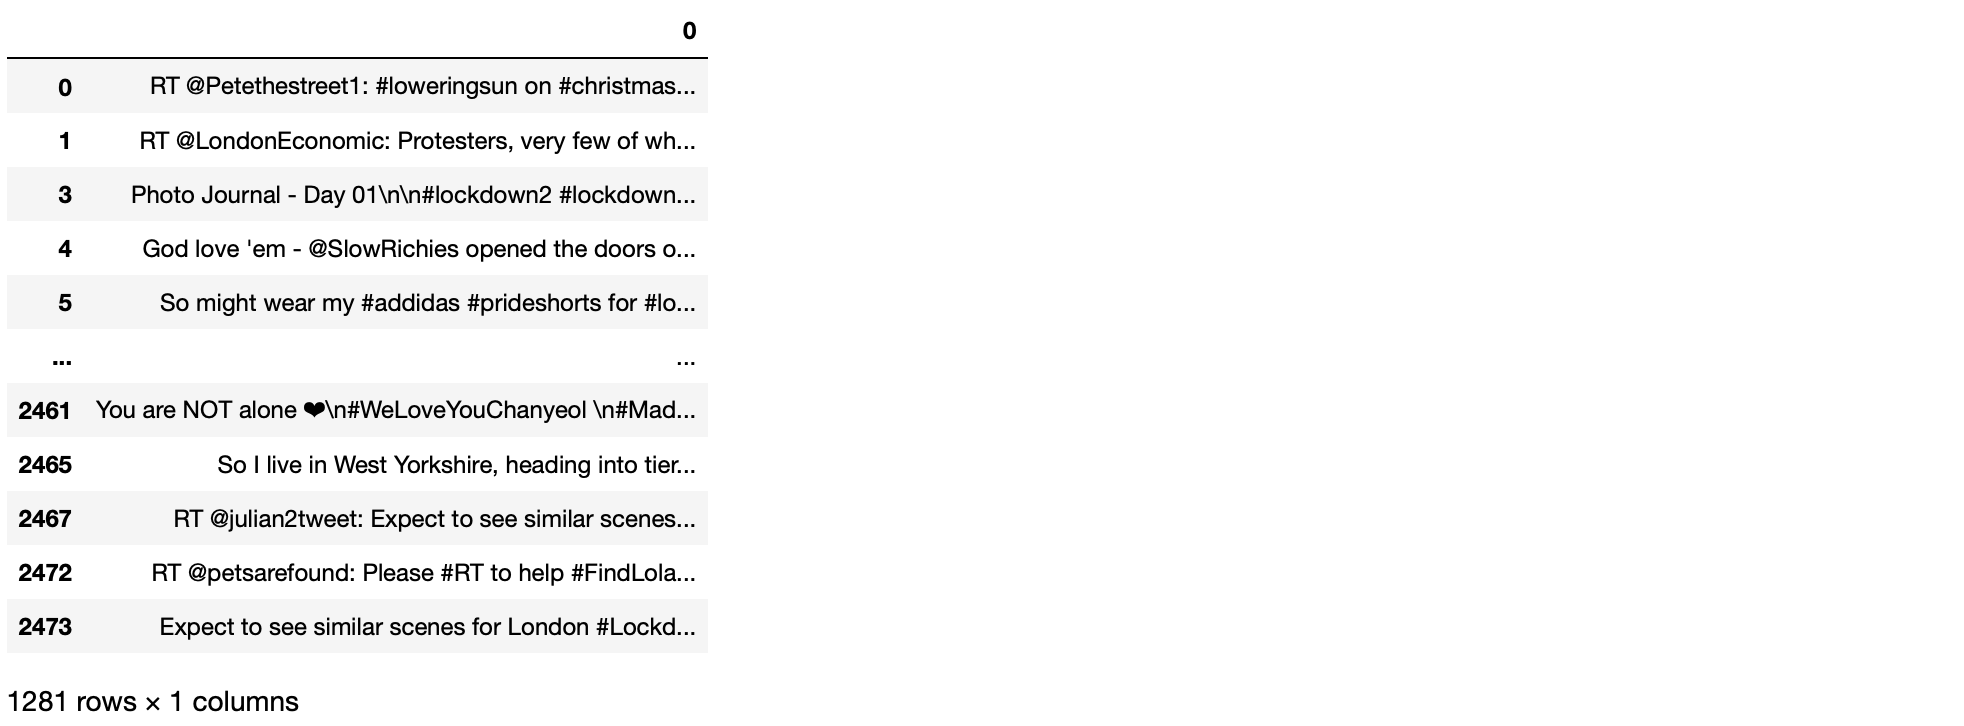
Our new data frame has 1281 unique tweets.
Firstly, I create new data frame (tw_list) and a new feature(text), then clean text by using lambda function and clean RT, link, punctuation characters and finally convert to lowercase.
#Cleaning Text (RT, Punctuation etc)#Creating new dataframe and new features
tw_list = pd.DataFrame(tweet_list)
tw_list["text"] = tw_list[0]#Removing RT, Punctuation etc
remove_rt = lambda x: re.sub('RT @w+: '," ",x)
rt = lambda x: re.sub("(@[A-Za-z0–9]+)|([⁰-9A-Za-z t])|(w+://S+)"," ",x)
tw_list["text"] = tw_list.text.map(remove_rt).map(rt)
tw_list["text"] = tw_list.text.str.lower()
tw_list.head(10)
Step 5: Sentiment Analyse
Now, I can use cleaned text to calculate polarity, subjectivity, sentiment, negative, positive, neutral and compound parameters again. For all calculated parameters, I create new features to my data frame
#Calculating Negative, Positive, Neutral and Compound valuestw_list[['polarity', 'subjectivity']] = tw_list['text'].apply(lambda Text: pd.Series(TextBlob(Text).sentiment))
for index, row in tw_list['text'].iteritems():
score = SentimentIntensityAnalyzer().polarity_scores(row)
neg = score['neg']
neu = score['neu']
pos = score['pos']
comp = score['compound']
if neg > pos:
tw_list.loc[index, 'sentiment'] = "negative"
elif pos > neg:
tw_list.loc[index, 'sentiment'] = "positive"
else:
tw_list.loc[index, 'sentiment'] = "neutral"
tw_list.loc[index, 'neg'] = neg
tw_list.loc[index, 'neu'] = neu
tw_list.loc[index, 'pos'] = pos
tw_list.loc[index, 'compound'] = comptw_list.head(10)
You can split your data frame into 3 groups based on sentiment. For this one, create 3 new data frame (tw_list_negative, tw_list_positive, tw_list_neutral) and import from original tw_list data frame
#Creating new data frames for all sentiments (positive, negative and neutral)tw_list_negative = tw_list[tw_list["sentiment"]=="negative"]
tw_list_positive = tw_list[tw_list["sentiment"]=="positive"]
tw_list_neutral = tw_list[tw_list["sentiment"]=="neutral"]Let’s count values for sentiment features and see total – percentage.
Function for count_values_in single columns
def count_values_in_column(data,feature):
 total=data.loc[:,feature].value_counts(dropna=False)
 percentage=round(data.loc[:,feature].value_counts(dropna=False,normalize=True)*100,2)
 return pd.concat([total,percentage],axis=1,keys=['Total','Percentage'])
#Count_values for sentiment
count_values_in_column(tw_list,"sentiment")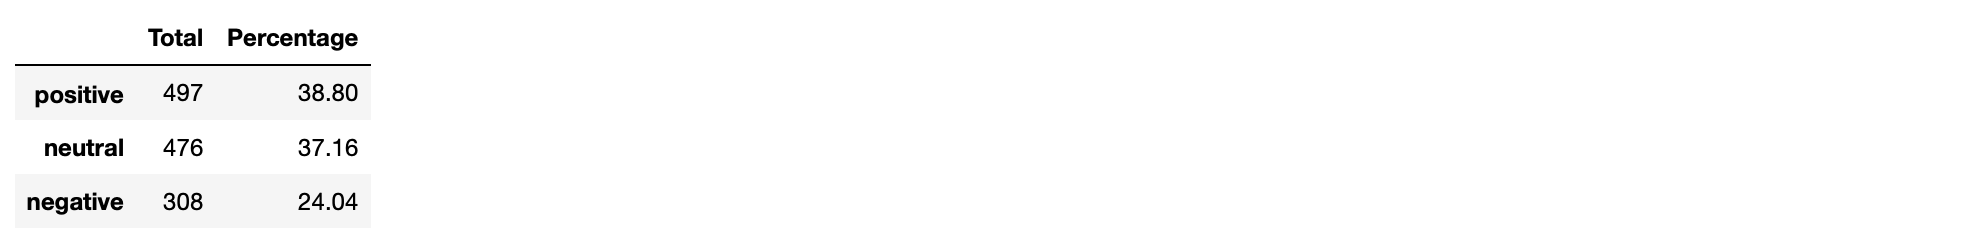
You can create a chart by using number of sentiment tweets.
# create data for Pie Chart
pichart = count_values_in_column(tw_list,"sentiment")
names= pc.index
size=pc["Percentage"]

# Create a circle for the center of the plot
my_circle=plt.Circle( (0,0), 0.7, color='white')
plt.pie(size, labels=names, colors=['green','blue','red'])
p=plt.gcf()
p.gca().add_artist(my_circle)
plt.show()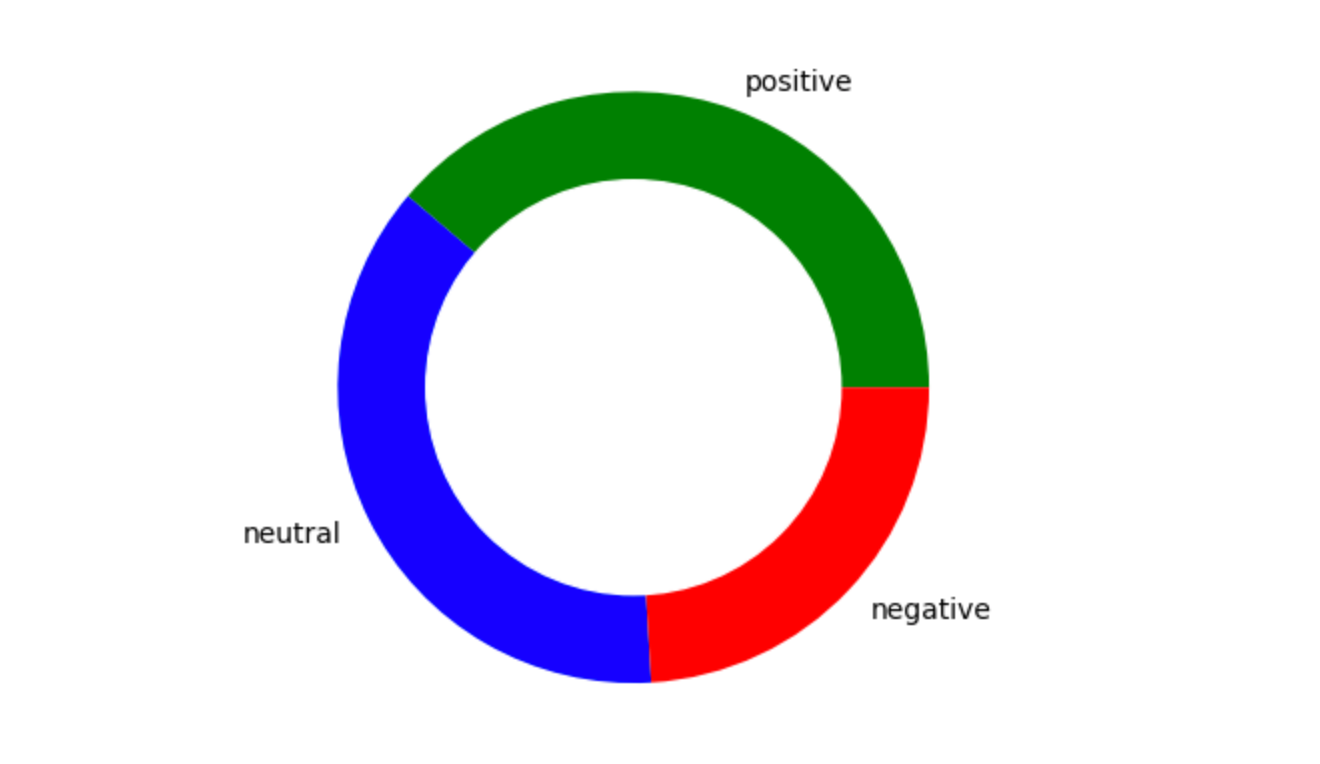
Now you can prepare to create worcloud using 1281 tweets, So you can realize that which words most used in these tweets. To create a worcloud, firstly let’s define a function below, so you can use wordcloud again for all tweets, positive tweets, negative tweets etc.
#Function to Create Wordclouddef create_wordcloud(text):
mask = np.array(Image.open("cloud.png"))
stopwords = set(STOPWORDS)
wc = WordCloud(background_color="white",
mask = mask,
max_words=3000,
stopwords=stopwords,
repeat=True)
wc.generate(str(text))
wc.to_file("wc.png")
print("Word Cloud Saved Successfully")
path="wc.png"
display(Image.open(path))After defining the function, you can have a look wordcloud for all tweets
#Creating wordcloud for all tweets
create_wordcloud(tw_list["text"].values)
Word Cloud for tweets that have positive sentiments;
#Creating wordcloud for positive sentiment
create_wordcloud(tw_list_positive["text"].values)
Word Cloud for tweets that have negative sentiments;
#Creating wordcloud for negative sentiment
create_wordcloud(tw_list_negative["text"].values)
Let’s calculate the tweet length and word count. So you can see the density of words and characters used in tweets based on different sentiment.
#Calculating tweet's lenght and word count
tw_list['text_len'] = tw_list['text'].astype(str).apply(len)
tw_list['text_word_count'] = tw_list['text'].apply(lambda x: len(str(x).split()))
round(pd.DataFrame(tw_list.groupby("sentiment").text_len.mean()),2)
round(pd.DataFrame(tw_list.groupby("sentiment").text_word_count.mean()),2)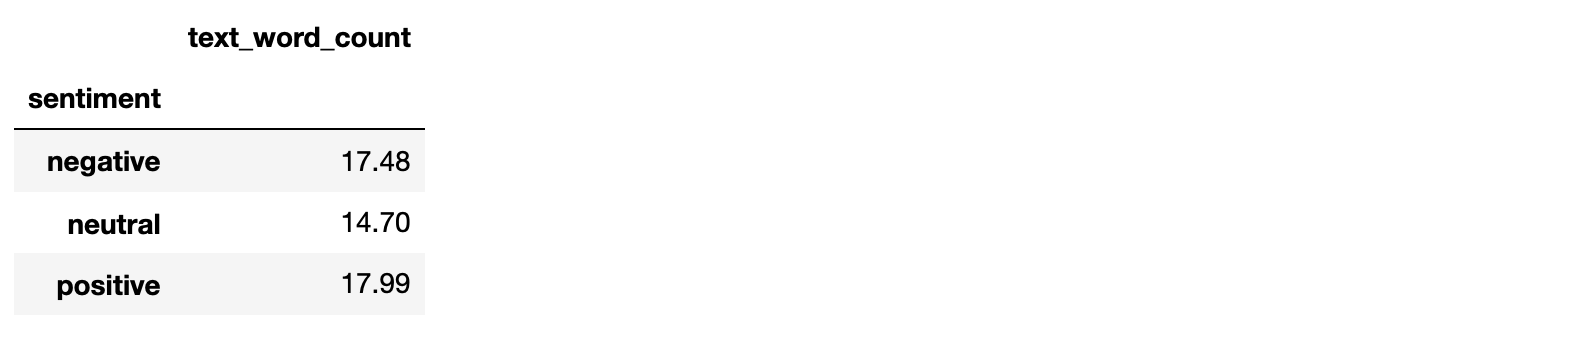
Applying count vectorizer provides the capability to preprocess your text data prior to generating the vector representation making it a highly flexible feature representation module for text. After count vectorizer, it is possible to analyze the words with two or three or whatever you want.
Applying stemmer is also provides the root of words. So you can eliminate words that come from the same root, such as ;
- connect
- connection
- connected
- connections
- connects
comes from "connect". If you apply the stemmer function, you can consider these all words as same
#Removing Punctuation
def remove_punct(text):
 text = "".join([char for char in text if char not in string.punctuation])
 text = re.sub('[0–9]+', '', text)
 return text
tw_list['punct'] = tw_list['text'].apply(lambda x: remove_punct(x))#Appliyng tokenization
def tokenization(text):
text = re.split('W+', text)
return texttw_list['tokenized'] = tw_list['punct'].apply(lambda x: tokenization(x.lower()))#Removing stopwords
stopword = nltk.corpus.stopwords.words('english')
def remove_stopwords(text):
text = [word for word in text if word not in stopword]
return text
tw_list['nonstop'] = tw_list['tokenized'].apply(lambda x: remove_stopwords(x))#Appliyng Stemmer
ps = nltk.PorterStemmer()def stemming(text):
text = [ps.stem(word) for word in text]
return texttw_list['stemmed'] = tw_list['nonstop'].apply(lambda x: stemming(x))#Cleaning Text
def clean_text(text):
text_lc = "".join([word.lower() for word in text if word not in string.punctuation]) # remove puntuation
text_rc = re.sub('[0-9]+', '', text_lc)
tokens = re.split('W+', text_rc) # tokenization
text = [ps.stem(word) for word in tokens if word not in stopword] # remove stopwords and stemming
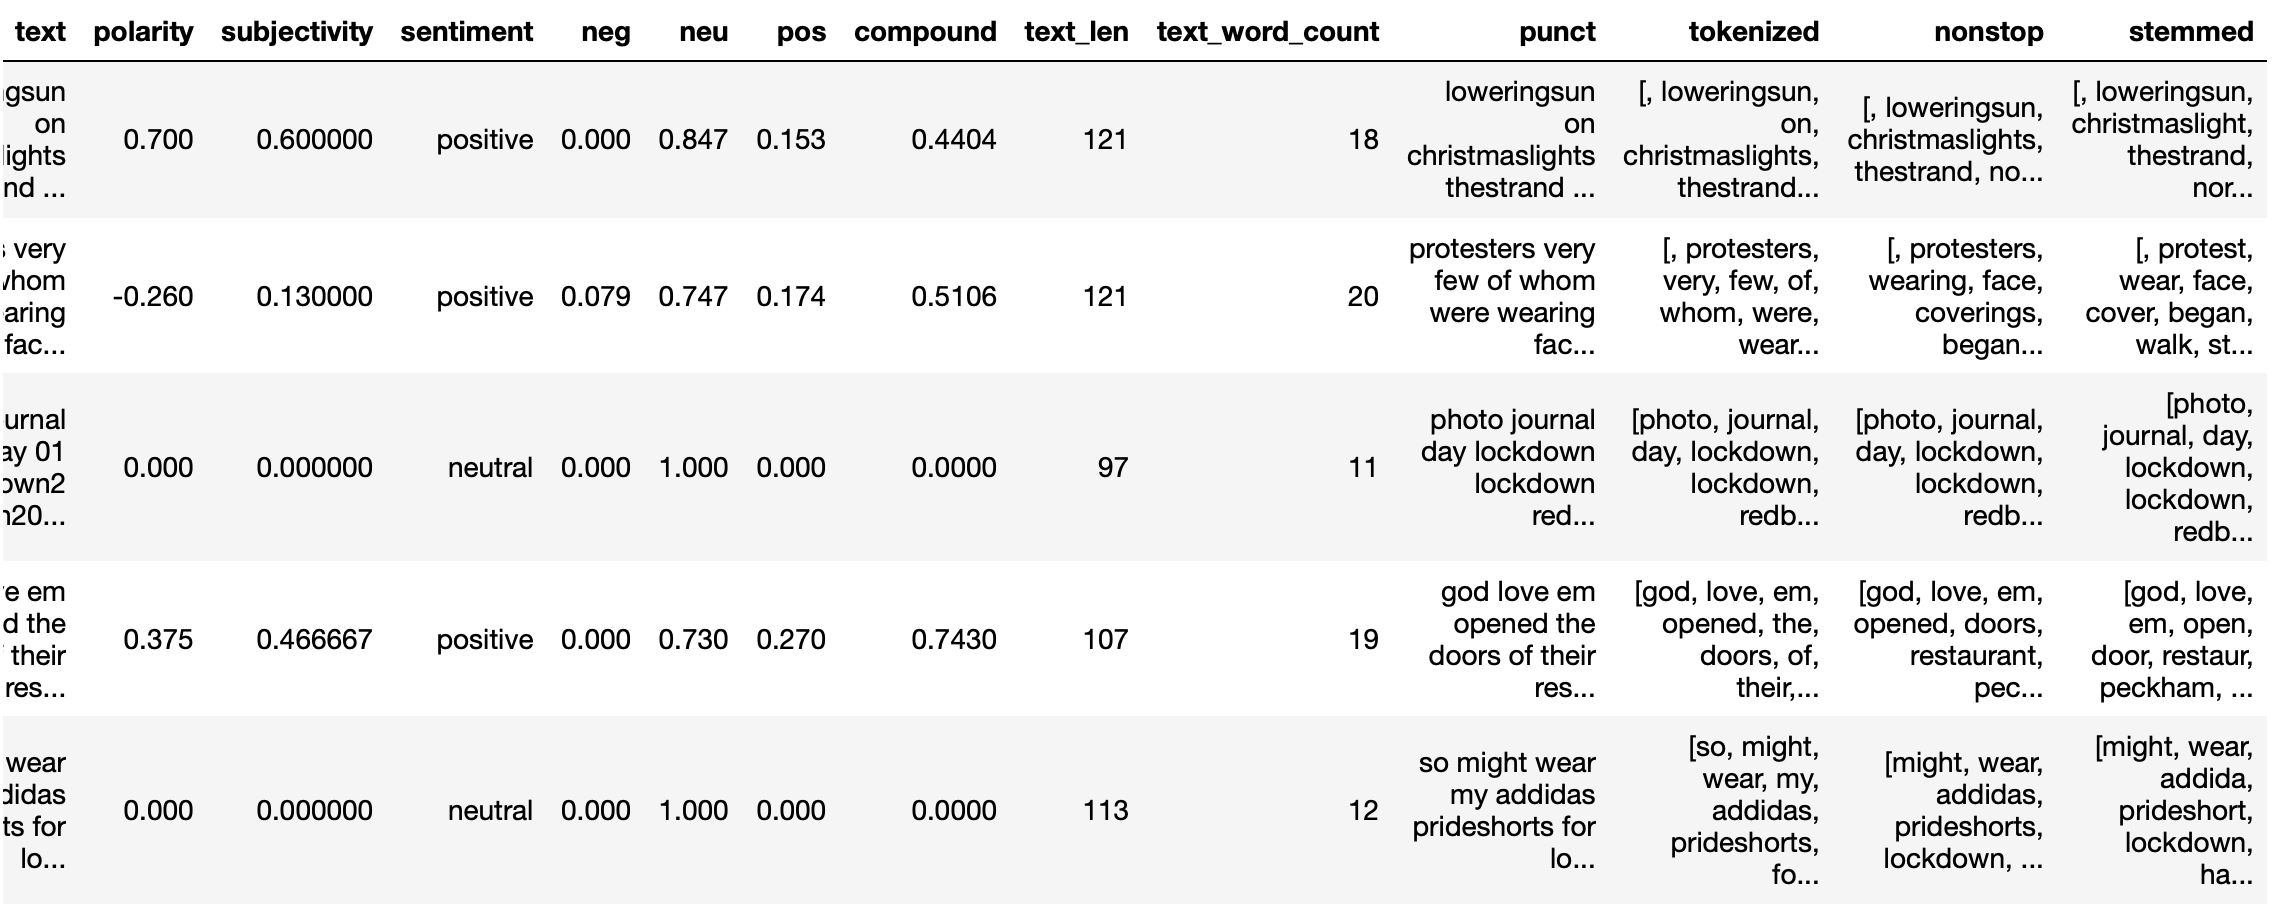
return texttw_list.head()After applying countverctorizer, two results show us all 1281 tweets have 2966 unique words.
If you have a look at our data frame, you can see new features such as punct, tokenized, nonstop, stemmed.
Now, you can apply coun vectorizer the see all 2966 unique words as a new features.
#Appliyng Countvectorizer
countVectorizer = CountVectorizer(analyzer=clean_text)
countVector = countVectorizer.fit_transform(tw_list['text'])
print('{} Number of reviews has {} words'.format(countVector.shape[0], countVector.shape[1]))
#print(countVectorizer.get_feature_names())
1281 Number of reviews has 2966 wordscount_vect_df = pd.DataFrame(countVector.toarray(), columns=countVectorizer.get_feature_names())
count_vect_df.head()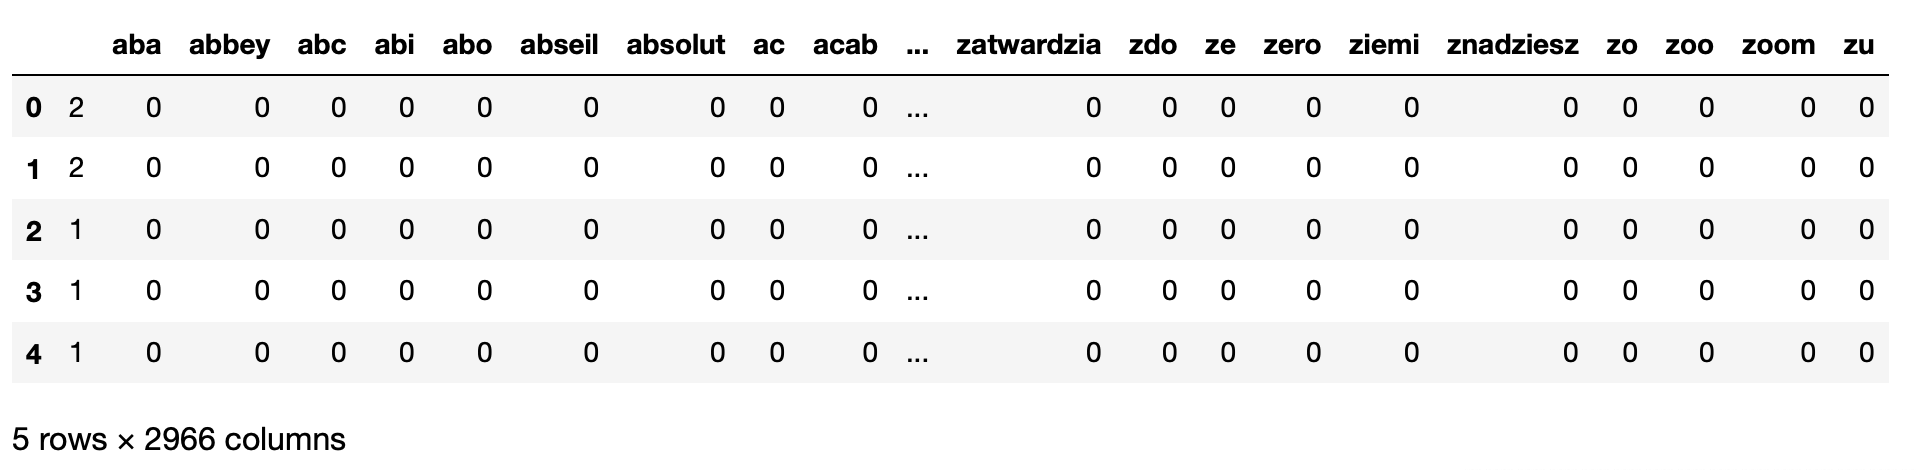
You can sort values as a descending to see most used words
# Most Used Words
count = pd.DataFrame(count_vect_df.sum())
countdf = count.sort_values(0,ascending=False).head(20)
countdf[1:11]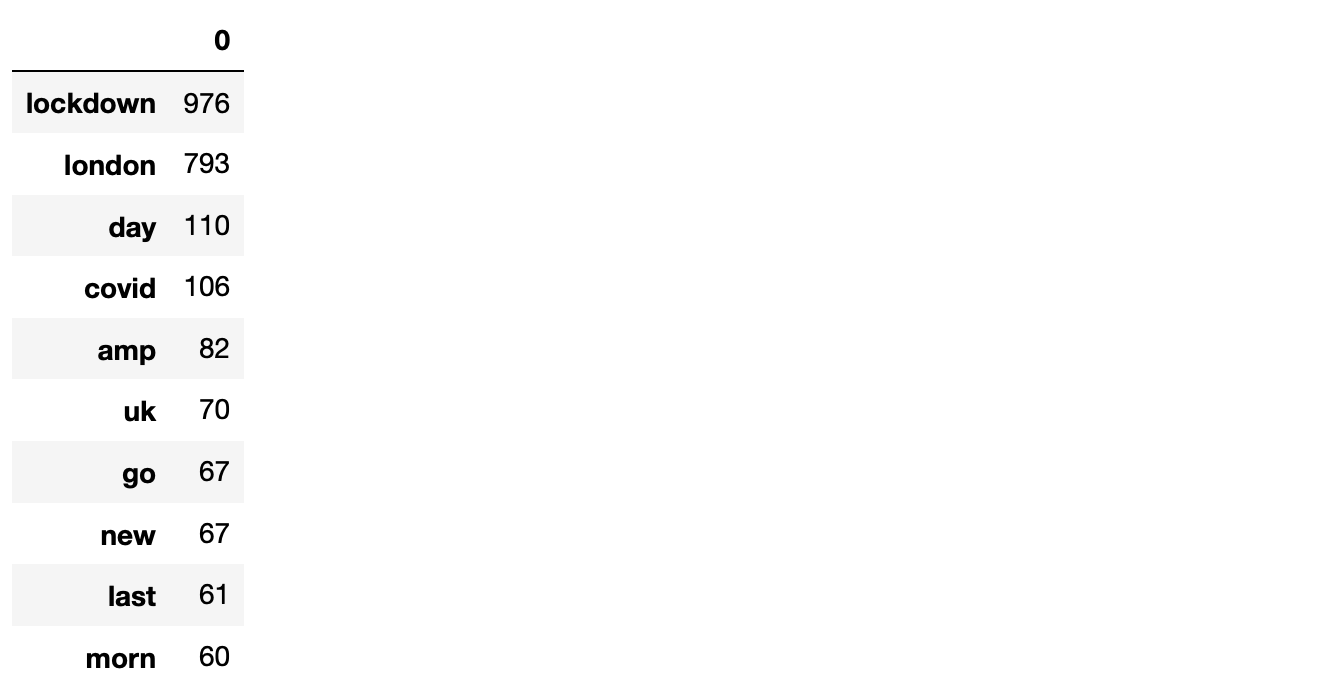
Building n gram model helps us to predict most probably word that might follow this sequence. Firstly let’s create a function then built n2_bigram, n3_trigram etc.
#Function to ngram
def get_top_n_gram(corpus,ngram_range,n=None):
 vec = CountVectorizer(ngram_range=ngram_range,stop_words = 'english').fit(corpus)
 bag_of_words = vec.transform(corpus)
 sum_words = bag_of_words.sum(axis=0)
 words_freq = [(word, sum_words[0, idx]) for word, idx in vec.vocabulary_.items()]
 words_freq =sorted(words_freq, key = lambda x: x[1], reverse=True)
 return words_freq[:n]
#n2_bigram
n2_bigrams = get_top_n_gram(tw_list['text'],(2,2),20)n2_bigrams
#n3_trigram
n3_trigrams = get_top_n_gram(tw_list['text'],(3,3),20)
n3_trigrams
Finally, you can analyze sentiment using tweets and you can realize which words most used and which words used together.
Thanks for reading my post and I hope you like it. Feel free to contact me if you have any questions or if you’d like to share your comments.


