Hands-on Tutorials

One of the most common questions I am asked by data scientists taking their first foray into graphs with Neo4j is how to get data into the database. In a previous post I showed how to do this in one of a few different ways using the Neo4j browser UI set up through Docker. In this post I will show how you can use your own data generated with Python to populate the database. I will also show you how to use a different Neo4j database setup using the Neo4j Sandbox.
A Google Colab notebook with the code for this post can be found here. (There are instructions in that notebook of how to connect Colab to Kaggle for getting your data downloaded more quickly.)
Necessary tools
- The Neo4j Python driver (version 4.2 at the writing of this post)
- Jupyter Notebook/Lab or Google Colab Notebook (optional)
- Pandas
Data cleaning with Python

Now we can actually start doing some data munging with Python. For the sake of this post we are going to use the arXiv Dataset found on Kaggle, which contains more than 1.7M scholarly STEM papers. (At the writing of this post, it is on Version 18.) You should go ahead and download that data to your local machine.
Moving now into your notebook, we can start thinking about our data. I have loaded the data in via:
(You don’t have to use tqdm, but I find it helpful to check my progress knowing the file size is over 1.79M entries.)
You can see via df.dtypes that our data is structured as:
id                object
submitter         object
authors           object
title             object
comments          object
journal-ref       object
doi               object
report-no         object
categories        object
license           object
abstract          object
versions          object
update_date       object
authors_parsed    object
Suppose we want to construct a graph with this dataframe and that we are curious about which authors are publishing which papers and then what categories those papers are associated with. We will then want to have three different node types corresponding to this: authors, papers, and categories. Each of these node types is going to have a property or two. For authors it makes sense that we know their name. The papers could have both their ID and their title. And lastly it also makes sense for the categories to have their own name. We also have some relationships: authors author papers and papers are in certain categories.
Therefore, our goal is to have the following data model (drawn with arrows.app):

There are a few columns that are going to be useful for us. For example, I plan on keeping id so we can use it as a unique index for each paper. After that, I want to get an individualized list of each author. Also, the authors_parsed column gives us a much cleaner listing of all authors. Definitely we will keep the title column as the main property for the paper. Lastly, I want to keep the categories columns.
The next step is to clean up our data a bit so I have one author per row of the dataframe along with a single category per row. For instance, we see that the authors_parsed column gives a list of lists where the entries each have a superfluous comma following the names. If we simply import this into the database as is, we will wind up with author nodes like (shown for a small sample):
╒════════════════════════════════════╕
│"n"                                 │
╞════════════════════════════════════╡
│{"name":["Balázs","C.",""]}         │
├────────────────────────────────────┤
│{"name":["Berger","E. L.",""]}      │
├────────────────────────────────────┤
│{"name":["Nadolsky","P. M.",""]}    │
├────────────────────────────────────┤
│{"name":["Yuan","C. -P.",""]}       │
├────────────────────────────────────┤
│{"name":["Streinu","Ileana",""]}    │
└────────────────────────────────────┘
Since that is not a very pleasant thing to look at (and will result in queries that are not the most elegant), we need to clean that up a bit. We also see that the categories column could have a single category, or several categories that are not in traditional list format (as shown in the last line of this sample):
╒═══════════════════════════════════╕
│"c"                                │
╞═══════════════════════════════════╡
│{"category":"hep-ph"}              │
├───────────────────────────────────┤
│{"category":"math.CO cs.CG"}       │
├───────────────────────────────────┤
│{"category":"physics.gen-ph"}      │
├───────────────────────────────────┤
│{"category":"math.CO"}             │
├───────────────────────────────────┤
│{"category":"math.CA math.FA"}     │
└───────────────────────────────────┘
We could do that in Cypher, but for the sake of this post we are going to do our cleaning in Python in order to hopefully illustrate that we can do as much or as little as we want using Python.
Let’s create a couple of helper functions for cleaning up those two columns:
Our resulting dataframe now looks like:
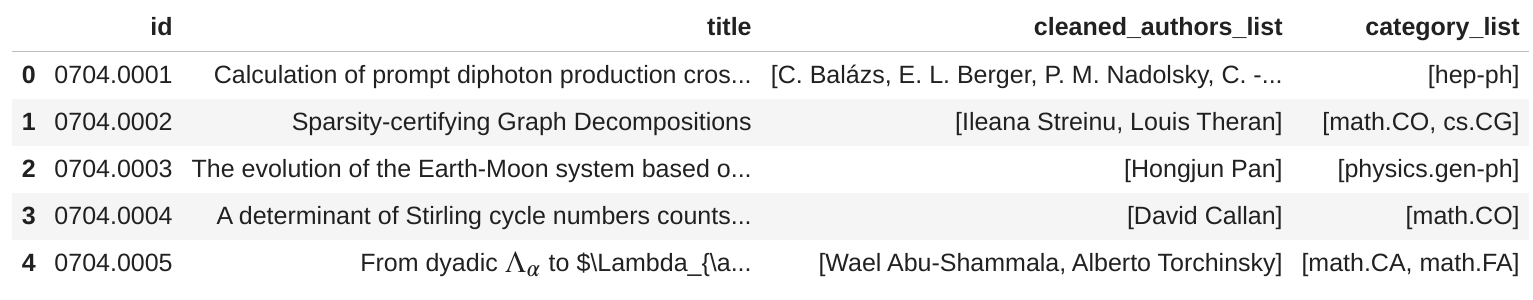
Now we have something we can work with!
Creating a Neo4j Sandbox

The Neo4j Sandbox is a nice, free way to get to tinker with Neo4j. You can spin up an instance that will persist for 3 days and get to work!
For the purposes of this article, when you get to the Sandbox, you will create a basic, blank sandbox like this:
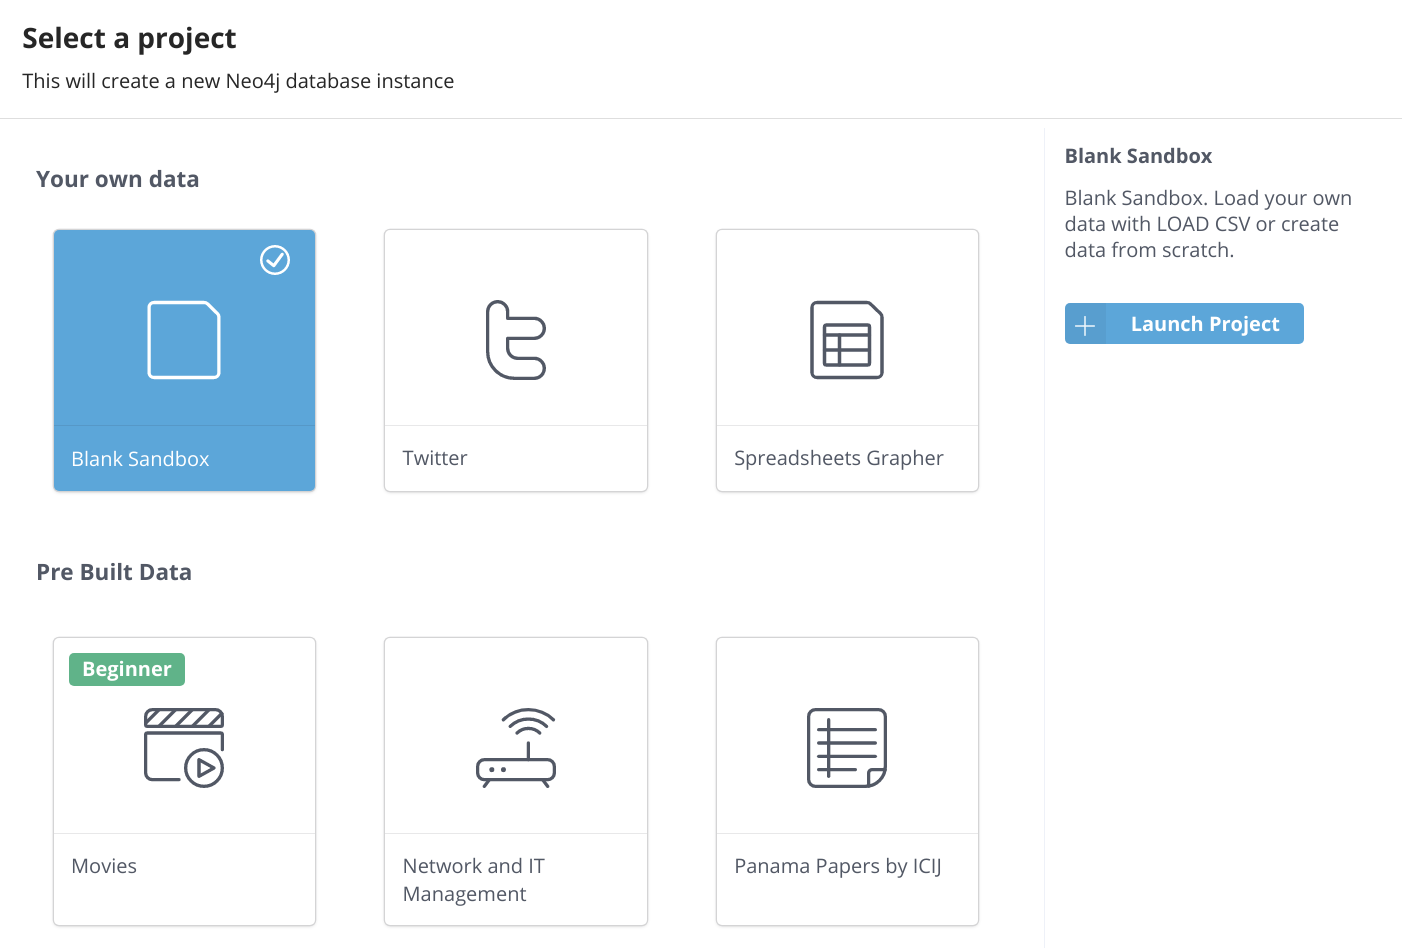
There are plenty of other useful Sandboxes, as you can see from the creation window, but we are going to select this option since we are going to populate the database with our own data. Sit back for a couple of minutes while it creates it. Once that happens, you will get your connection information, as shown below:
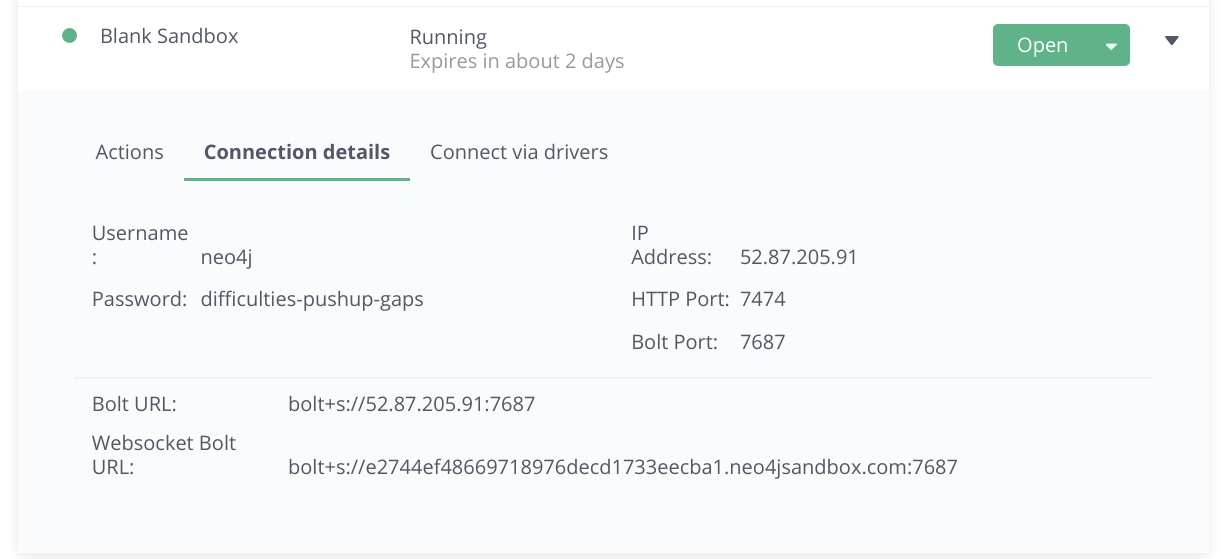
There are a few things you will need with this window. First, you will note the Bolt URL, complete with its port number. You will need this to establish the connection via Python. Next, you will also need the password ("difficulties-pushup-gaps" in this case). This will be needed to authenticate into this instance. I would point out that after 3 days when this instance gets taken down, this information is no longer valid, so no worries about trying to scoop my Sandbox and its data!
Connecting to Neo4j and populating the database
Now we need to establish the connection between our local machine (or wherever we have our Python code) and the Sandbox database. This is where those BOLT URL and passwords will come in.
I have created a helper class for doing this, which is very slightly modified from this Medium post:
Cool. Now we can start populating the database. We start by creating some constraints within the database that will ensure the nodes are not duplicates while also setting up some indexing:
Now we create three functions for creating dataframes for the category and author nodes, which we will use to populate each into the database separately:
These functions take each column into the variable $rows and those columns are of list format. The UNWIND command takes each entity of the list and adds it to the database. After this we use a secondary function to update the database in batch mode, which can be helpful when you are dealing with more than about 50k uploads.
After we have these nodes loaded in, we will add the paper nodes as well as all relationships with the following functions:
So in a similar fashion to the category and author nodes, we create each paper and then connect it via the :AUTHORED or :IN_CATEGORY relationships for each row of the dataframe (UNWINDing the lists as needed). Note that there is much more data moving through the pipe in this function, so it might help to decrease the batch size to prevent time out errors.
Also, for this step we might be tempted to use a method like explode.() on the complete dataframe to get one row for each element of each list and processing the entire dataframe into the database that way. That can work and that is exactly what we will do below for small amounts of data like a deduplicated category and author node list in the categories and authors dataframes. However, for larger datasets it is not a very efficient way to load data into Neo4j. Because Neo4j is a transactional database, we would be creating one and executing one single statement per row of the dataframe, which will result in a very slow loading process. It also could exceed the available memory. Sandbox instances have approximately 500 MB of heap memory and 500 MB of page cache. So this further motivates updating the database as a batch process.
Executing all of these functions to populate the graph, we have:
Great! We now have a populated database! Here is what a subsample of that graph should look like (obtained via MATCH (a:Author)-[:AUTHORED]->(p:Paper)-[:IN_CATEGORY]->(c:Category) RETURN a, p, c LIMIT 300:

Let’s make sure it has what we want in it…
Querying the database to get some answers back
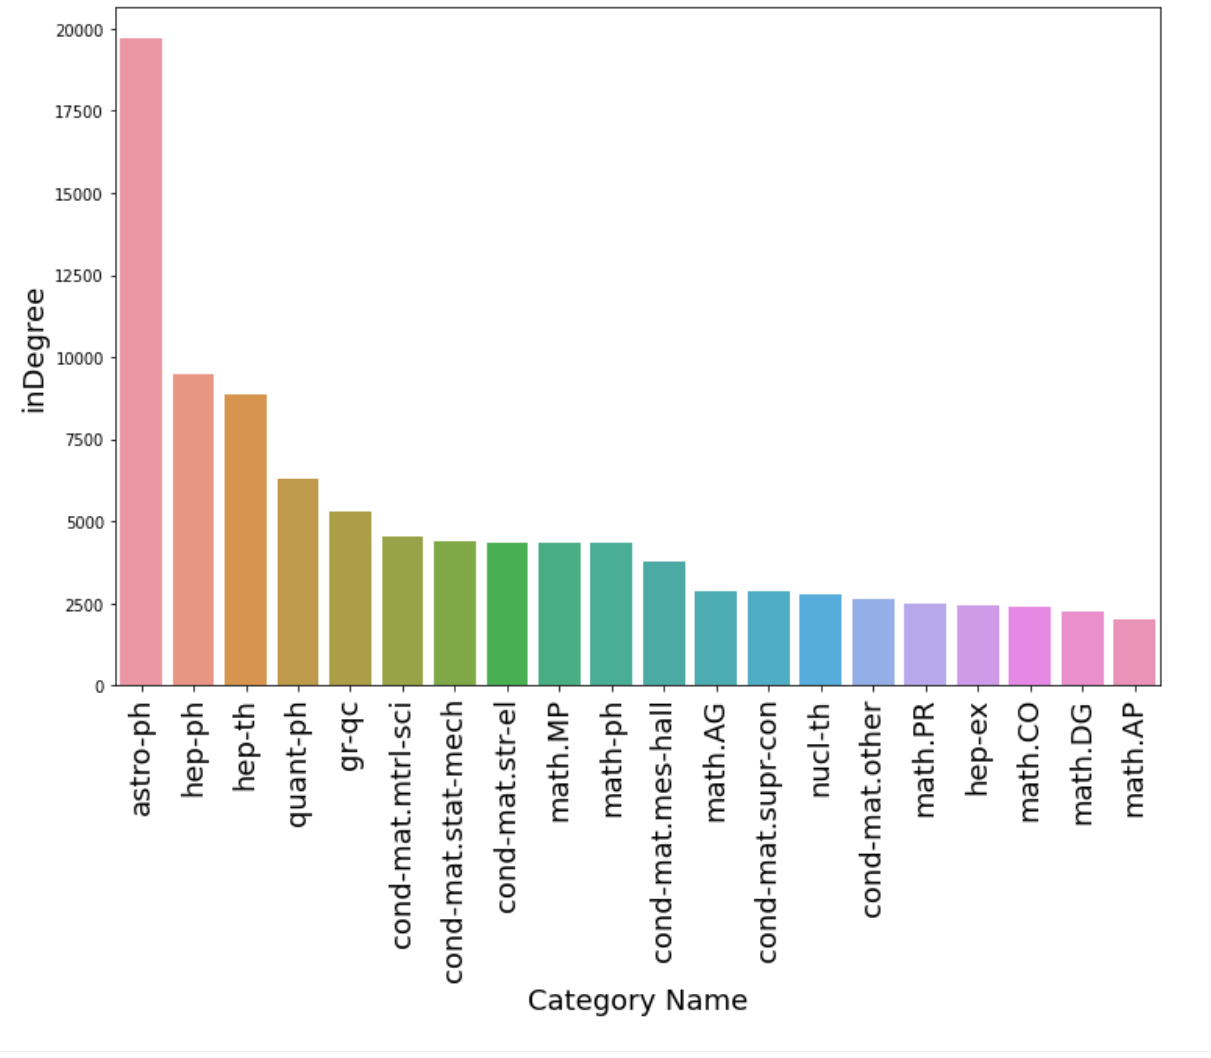
Here is a tip: when you have a populated database, you should let Neo4j handle as many calculations as you can before bringing the answers back into Python (if you even need to). In this case, suppose we want to calculate the in-degree of each category and return the categories of the top 20 categories. Obviously we could just do this simplistic thing in Python, but let’s do it in Neo4j. At some point you will want to do more complicated calculations (such as node centrality, path finding, or community detection), which can and should all be done in Neo4j before downloading those results back into Python.
To do this in Cypher, we could use any number of several approaches, but here is a quick one that works:
This should give us:
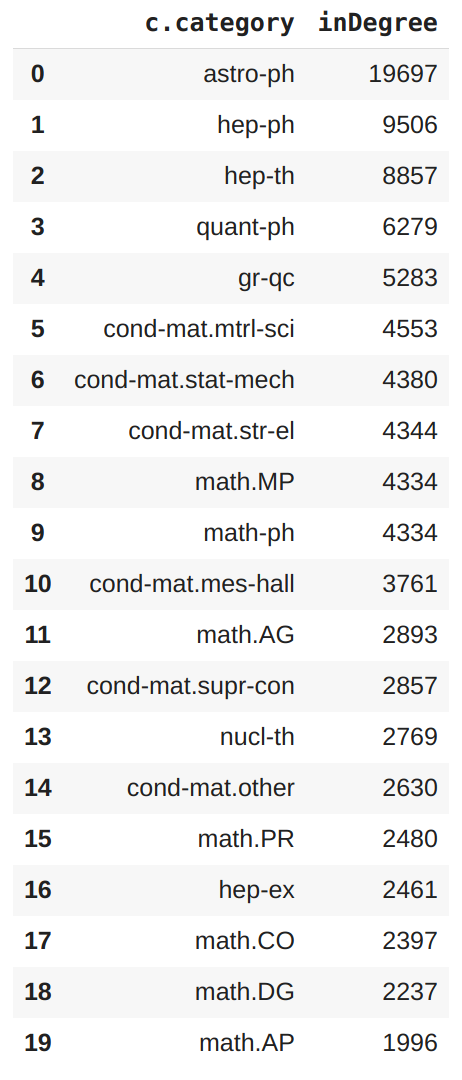
The distribution of the in-degree for the above subset of data looks like this:
So this shows that the database is both populated and how we can get results back. For what it is worth, another way you could get those same results returned in list form would be:
Summary
We have shown how to connect to a Neo4j Sandbox from Python and upload our data once we are satisfied that it contains what we want. Like anything else in coding, there are a ton of different ways to do this and the interested user is encouraged to explore doing the above demonstration predominantly in Cypher rather than Python. But by using the Neo4j Python connector it is easy to go back and forth between Python and your Neo4j database, just as it is for any other major database. This will open up all kinds of exciting possibilities in data science and machine learning, such as automated node classification, link prediction, and node clustering. Stay tuned for future blog posts on those subjects!
Special thanks to Michael Hunger and Mark Needham for their assistance on this post!


