
Be sure to subscribe here or to my personal newsletter to never miss another article on Data Science guides, tricks and tips, life lessons, and more!
Table of Contents
- About This Resource
- Confidence Intervals
- Z-Statistics vs T-statistic
- Hypothesis Testing
- A/B Testing
- Linear Regression
- Probability Rules
- Bayes Theorem
- Interview Practice Questions
About This Resource
When I was applying to Data Science jobs, I noticed that there was a need for a comprehensive statistics and probability cheat sheet that goes beyond the very fundamentals of statistics (like mean/median/mode).
And so, Nathan Rosidi, founder of StrataScratch, and I collaborated to cover the most important topics that commonly show up in data science interviews. These topics focus more on statistical methods rather than fundamental properties and concepts, meaning it covers topics that are more practical and applicable in real-life situations.
With that said, I hope you enjoy it!
Confidence Intervals
A confidence interval suggests a range of values that is highly likely to contain a parameter of interest.
For example, suppose you sampled 5 customers who rated your product a mean of 3.5 out of 5 stars. You can use confidence intervals to determine what the population mean (the average rating of all customers) is based on this sample statistic.
Confidence Interval for means (n ≥ 30)

Confidence Interval for means (n < 30)

Confidence Interval for proportions

Hypothesis Testing
Hypothesis testing is used to determine how likely or unlikely a hypothesis is for a given sample of data. Technically, hypothesis testing **** is a method in which a sample dataset is compared against the population data.
Here are the steps to performing a hypothesis test:
- State your null and alternative hypotheses. To reiterate, the null hypothesis typically states that everything is as normally was – that nothing has changed.
- Set your significance level, the alpha. This is typically set at 5% but can be set at other levels depending on the situation and how severe it is to commit a type 1 and/or 2 error.
- Collect sample data and calculate sample statistics (z-statistic or t-statistic)
- Calculate the p-value given sample statistics. Once you get the sample statistics, you can determine the p-value through different methods. The most common methods are the T-score and Z-score for normal distributions. Learn more about T-score and Z-score here.
- Reject or do not reject the null hypothesis.
You can test your knowledge on hypothesis testing, confidence intervals, and general statistics here!
Be sure to subscribe here or to my personal newsletter to never miss another article on data science guides, tricks and tips, life lessons, and more!
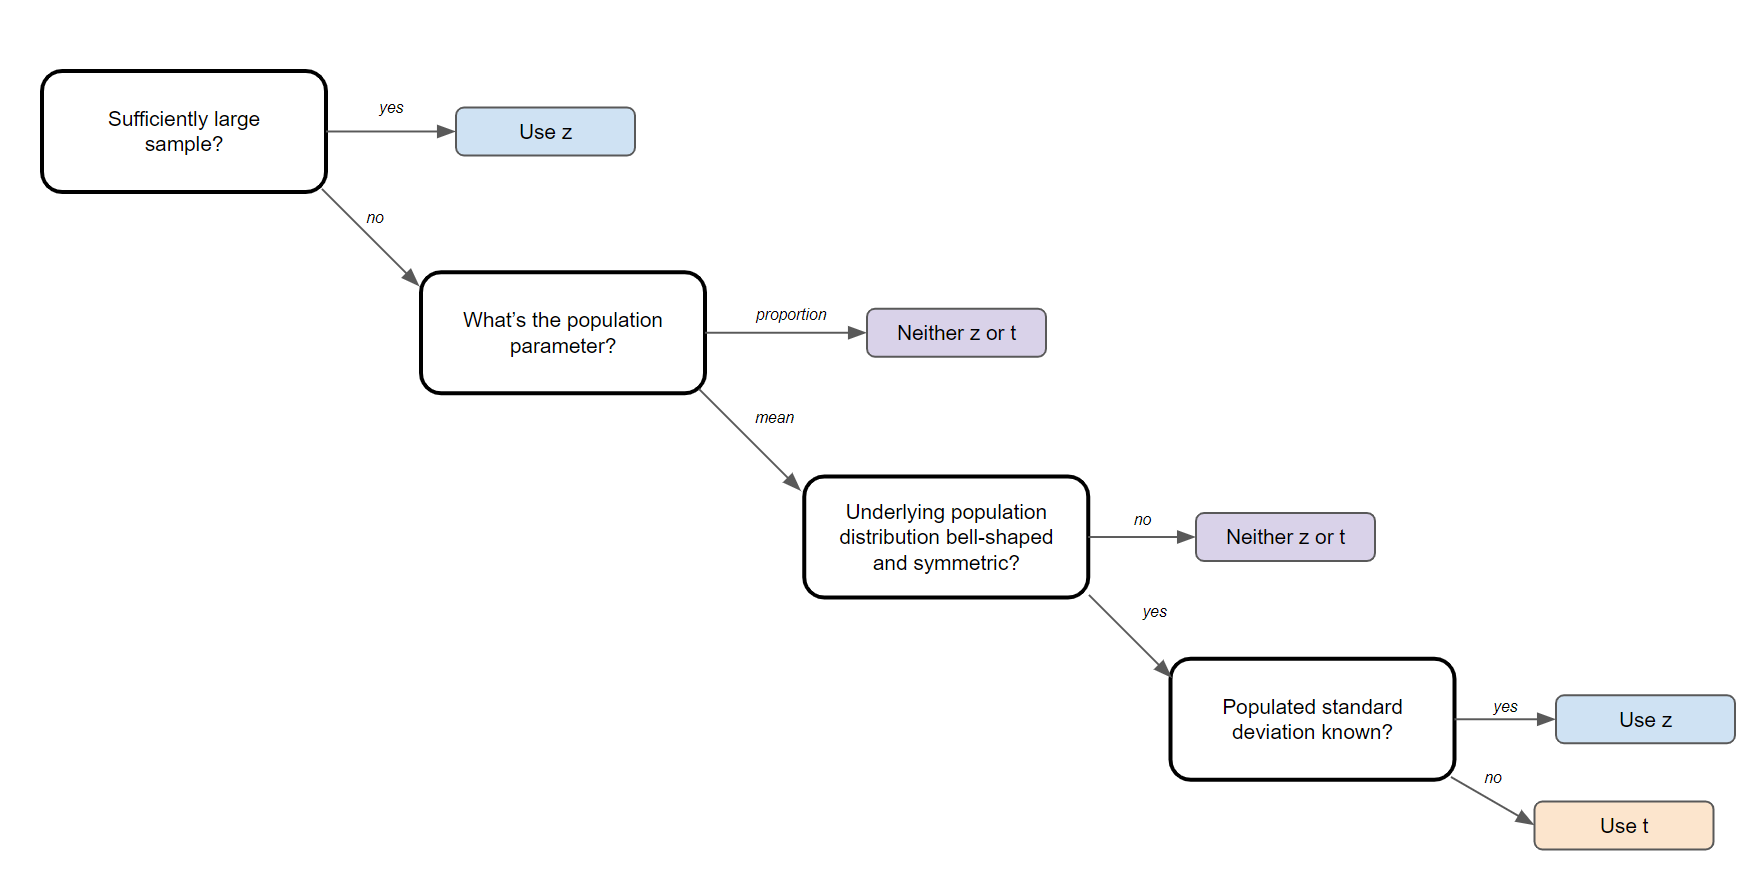
Z Statistic vs T Statistic
Z Statistics and T Statistics are important to know because they are required for step 3 in the steps to performing a hypothesis test (see above).
A Z-test is a hypothesis test with a normal distribution that uses a z-statistic. A z-test is used when you know the population variance or if you don’t know the population variance but have a large sample size.

A T-test is a hypothesis test with a t-distribution that uses a t-statistic. You would use a t-test when you don’t know the population variance and have a small sample size. You also need the degrees of freedom to convert a t-statistic to a p-value.


A/B Testing

A/B testing in its simplest sense is an experiment on two variants to see which performs better based on a given metric. Technically speaking, A/B testing is a form of two-sample hypothesis testing, which is a method in determining whether the differences between two samples are statistically significant or not.
The steps to conducting an A/B test are exactly the same as a hypothesis test, except that the p-value is calculated differently depending on the type of A/B test.
The type of A/B test that is conducted depends on a number of factors, which I’ll go over below:
Note: I won’t be covering the math behind these tests but feel free to check out Francesco’s article on A/B testing here.
Fisher’s Exact Test
The Fisher’s test is used when testing against a discrete metric, like clickthrough rates (1 for yes, 0 for no). With a Fisher’s test, you can compute the exact p-value, but it is computationally expensive for large sample sizes.
Pearson’s Chi-squared Test
Chi-squared tests are an alternative to Fisher’s test when the sample size is too large. It is also used to test discrete metrics.
Student’s t-test
I included the t-test and not the z-test because the z-test is typically impractical in reality since the population standard deviations are typically unknown. However, since we can get the sample standard deviation, a t-test is suitable.
It can be used under the conditions that the sample size is large (or the observations are normally distributed), and if the two samples have similar variances.
Welch’s Test
Welch’s t-test is essentially the same thing as Student’s t-test except that it is used when the two samples do not have similar variances. In that case, Welch’s test can be used.
Mann-Whitney U test
The Mann-Whitney test is a non-parametric test and should only be used when all assumptions for all previous tests are violated. For example, if you have a small sample size and the distributions are not normal, a Mann-Whitney test might be suitable.
_To see how to conduct these tests in Python, check out this repository._
Linear Regression
What is regression?
Regression is simply a statistical method for estimating the relationship between one or more independent variables (x) and a dependent variable (y). In simpler terms, it involves finding the ‘line of best fit’ that represents two or more variables.

The line of best fit is found by minimizing the squared distances between the points and the line of best fit – this is known as least squares regression. A residual is simply equal to the predicted value minus the actual value.
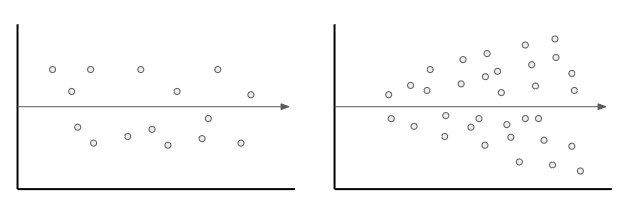
Residual analysis
A residual analysis can be conducted to assess the quality of a model, and also to identify outliers. A good model should have a homoscedastic residual plot, meaning that the error values are consistent overall.
Variable Selection
Two very simple and common approaches to variables selection are backward elimination (removing one variable at a time) or forward selection (adding one variable at a time).
You can assess whether a variable is significant in a model by calculating its p-value. Generally speaking, a good variable has a p-value of less than or equal to 0.05.
Model Evaluation
To evaluate a regression model, you can calculate its R-squared, which tells us how much of the variability in the data that the model accounts for. For example, if a model has an R-squared of 80%, then 80% of the variation in the data can be explained by the model.
The adjusted R-squared is a modified version of r-squared that adjusts for the number of predictors in the model; it increases if the new term improves the model more than would be expected by chance and vice versa.
3 Common pitfalls to avoid
- Overfitting: Overfitting is an error where the model ‘fits’ the data too well, resulting in a model with high variance and low bias. As a consequence, an overfit model will inaccurately predict new data points even though it has a high accuracy on the training data. This typically happens when there are too many independent variables in the model.
- Collinearity: This is when two independent variables in a model are correlated, which ultimately reduces the accuracy of the model.
- Confounding variables: a confounding variable is a variable that isn’t included in the model but affects both the independent and dependent variables.
Probability Rules
There are several fundamental properties and four probability rules that you should know. These probability rules serve as the foundation for more complex (but still fundamental) equations, like Bayes Theorem, which will be covered after.
Note: this does not review joint probability, union of events, or intersection of events. Review them beforehand if you do not know what these are.
Basic Properties
- Every probability is between 0 and 1.
- The sum of the probabilities of all possible outcomes equals 1.
- If an event is impossible, it has a probability of 0.
- Conversely, certain events have a probability of 1.
The Four Probability Rules
1. Addition Rule

2. Complementary Rule

3. Conditional Rule

4. Multiplication Rule

To practice using these equations, you can check out this resource.
Bayes Theorem
Bayes theorem is a conditional probability statement, essentially it looks at the probability of one event (B) happening given that another event (A) has already happened. The formula is as follows:

- P(A) is the prior, which is the probability of A being true.
- P(B|A) is the likelihood, the probability of B being true given A.
- P(B) is the marginalization or the normalizing constant
- P(A|B) is the posterior.
What you’ll find in a lot of practice problems is that the normalizing constant, P(B), is not given. In these cases, you can use the alternative version of Bayes Theorem, which is below:

To get a better understanding of Bayes Theorem and follow along with some practice questions, check out here.
Combinations and Permutations
Combinations and permutations are two slightly different ways that you can select objects from a set to form a subset. Permutations take into consideration the order of the subset whereas combinations do not.
Combinations and permutations are extremely important if you’re working on network security, pattern analysis, operations research, and more. Let’s review what each of the two are in further detail:
Permutations
Definition: A permutation of n elements is any arrangement of those n elements in a definite order. There are n factorial (n!) ways to arrange n elements. Note the bold: order matters!
The number of permutations of n things taken r-at-a-time is defined as the number of r-tuples that can be taken from n different elements and is equal to the following equation:

Example Question: How many permutations does a license plate have with 6 digits?

Combinations
Definition: The number of ways to choose r out of n objects where order doesn’t matter.
The number of combinations of n things taken r-at-a-time is defined as the number of subsets with r elements of a set with n elements and is equal to the following equation:

Example Question: How many ways can you draw 6 cards from a deck of 52 cards?

Note that these are very very simple questions and that it can get much more complicated than this, but you should have a good idea of how it works with the examples above!
Interview Practice Questions
If you made it this far, here are some resources that you can use to test your knowledge:
- StrataScratch is essentially LeetCode but for data science. It has hundreds of questions on statistics, Python, Pandas, and SQL. It’s no surprise that Nathan, the founder of StrataScratch, helped me curate and develop this crash course.
- If you haven’t checked it out already, I previously wrote an article, "50 Statistics Interview Questions and Answers for Data Scientists" which I encourage you to check out.
Be sure to subscribe here or to my personal newsletter to never miss another article on data science guides, tricks and tips, life lessons, and more!
Thanks for Reading!
If you made it to the end, congrats! I hope you found this useful in refreshing and patching up your statistics knowledge. I know there’s a lot to remember, but the more often you use it, the less likely you’ll lose it.
As always, I wish you the best in your data science endeavors. If you liked this article, I’d appreciate it if you gave me a follow! 
Again, a special thanks to Nathan Rosidi. You can check out his website, StrataScratch, here.
Not sure what to read next? I’ve picked another article for you:
50+ Statistics Interview Questions and Answers for Data Scientists for 2021
and another one!
A Complete 52 Week Curriculum to Become a Data Scientist in 2021
Terence Shin
- If you enjoyed this, follow me on Medium for more
- Interested in collaborating? Let’s connect on LinkedIn
- Sign up for my email list here!


