Which party adds more to deficits?
Hint: it’s the Republicans
Tax Cuts Do Not Pay For Themselves
Both the Bush and Trump administrations argued that “tax cuts pay for themselves” as each passed significant tax cuts soon after taking office. The data suggests that this logic is faulty, as tax rates in the U.S. aren’t high enough to produce significant behavioral changes when they are reduced, and typical reductions aren’t large enough to have immediate impacts. Instead of spurring economic growth and thus more revenues, tax cuts simply increase budget deficits.
The discussion surrounding taxes and budget deficits tends to re-open every election season, as Republicans and even some Democrats worry about large deficits and a growing national debt.
While Republicans often claim that they are the more fiscally responsible party, my research suggests otherwise. Compared to Democratic presidents, Republicans are estimated to add between 0.75% and 1.2% more to the deficit (as a percent of GDP) each year they are in office. This result controls for economic conditions, and explains 75% of the variation in the annual changes to deficits.
What causes deficits?
A deficit occurs when annual revenues fall short of expenses and the government is forced to borrow money from investors by issuing debt, much like how you and I borrow from a bank or a credit card. The national debt is the result of accumulated deficits — when we charge to the national credit card faster than we pay down the principal.
The figure below shows annual changes to deficits each year, that is to say, how much the deficit grows or shrinks compared to the year before. The blue portions show changes in government expenditures as a percent of GDP broken out by defense and non-defense expenditures(times negative one), so a reduction in expenditures will be greater than zero. The yellow shows the changes in revenues as a percent of GDP. When bars combine to be less than zero overall, that means the deficit increased over the prior year.

This chart shows how much deficits change as a result of reduced revenues or increased spending, or both. For instance, decreases in deficits occurred consistently in the Clinton years as expenditures decreased and revenues increased.
The George W. Bush administration experienced two recessions, one slight at the beginning of the term and the great recession starting late 2007 and through early 2009. Notice that the reduction of revenues in 2002 is just as significant as in 2009. This isn’t primarily the result of people making less money and paying less taxes — this is a significant tax cut that reduced revenues. Similarly, the effects of the Trump tax cuts are visible in 2018, as revenues decreased even more than during the great recession of 2008–2009.
Deficits and Economic Cycles
There is another pattern afoot in the chart above — there is a cyclical pattern with several years of increases to deficits, followed by several years of decreases. This is because deficits tend to increase during weak economies and recessions, and they tend to decrease when the economy improves. This is because of automatic stabilizers, policies that reduce the amount of taxes people and businesses pay when they make less money, and increase expenditures when the government lends a helping hand.
The government has additional choices to make when times are bad. For instance, both the Bush and Obama administrations passed stimulus packages that included a combination of tax cuts and increased spending. Both of these laws were aimed at stimulating the economy by putting money in people’s hands — a counter-cyclical policy that most economists agree is a good thing.
However, running deficits when the economy is good, as is the current state of affairs in the U.S., is called a pro-cyclical policy, which many economists agree is less than ideal. This appears to be a more typical pattern of Republican presidents than Democrats.
Comparing Republican and Democratic Deficit Policies
In order to make a fair comparison between Democratic and Republican deficit policies, one has to account for the economic conditions that each president encounters in office. It’s possible for one party to be unlucky and have more terms in recession periods, which would make it appear as though that party is more spendthrift.
There are statistical methods allow one to estimate the effect of the party in the presidency on changes in deficits, accounting for other variables that also have an impact on deficits. Such an analysis can be found here.
The first step is to get an understanding of which variables are associated with deficits on their own. The chart below shows a sample of those results. The red bars show variables that are associated with increased deficits (the greater the correlation, the greater the impact) and the blue shows those that are associated with reduced deficits.

Unsurprisingly, economic growth tends to reduce deficits, as growth improves tax collection and reduces the need for additional government spending. What is surprising is that even at a high level, Democratic presidents are associated with decreased deficits, with a correlation of -32% (usually, correlations of 0.25 or more in either direction are considered something in social science). This is a greater impact on deficits than the typical increase in the top marginal tax rate.
That being said, it’s important to keep in mind that the association between variables that appear in a univariate analysis like this correlation chart often changes (or disappears entirely) when moving to a more sophisticated multivariate analysis that estimates the independent effect of many variables on deficits.
After a dozen or so iterations, I developed a statistical model that controls for economic conditions and estimates the independent impact of Republicans in the presidency. The end model includes straightforward variables: last year’s deficit, last year’s per capita GDP growth, this year’s per capita GDP growth, and the party of the president. The model incorporates the interactions between variable economic growth and the president’s party. For instance, it can estimate the effect on deficits of having poor growth both this year and last year, and it can estimate the difference between how Republicans and Democrats respond to deficits in good or bad economic periods. It also estimates the general difference between the two party’s changes to budget deficits.
Overall, the model explains nearly three quarters of the variation in annual changes to budget deficits. The chart below shows changes in deficits predicted by the model, versus what actually happened.

There are two interesting findings from this analysis. First, even with a relatively small sample size, the model is able to find a sizable, statistically significant difference between Democratic and Republican presidents, with Republicans adding 0.97% (p-value <0.01%) more to deficits on average every year. This effect is robust to outliers as well, as the difference in the median deficit change is 1.23% (p-value 0.01%).
Second, Democratic presidents tend to have more aggressively counter-cyclical policies than Republicans. This effect is heavily influenced by the fact that both Clinton and Obama reduced deficits when times were good and Obama increased them significantly when times were bad. It’s also influenced by Republicans like Trump adding to deficits when the economy is strong.
Using this model, we can show the effect of Democratic and Republican policies, controlling for economic conditions. We can ask it to predict the changes in deficits for each party, holding all economic conditions constant, and then find the difference. The plot below shows those differences. Values above zero shows that Republicans would be expected to add to the deficit given the economic conditions in that year, and values less than zero show that Democrats are expected to add to the deficit given economic conditions of that year. This analysis plays out the scenario of how things would be different between Democrats and Republicans if they controlled the presidency every year.
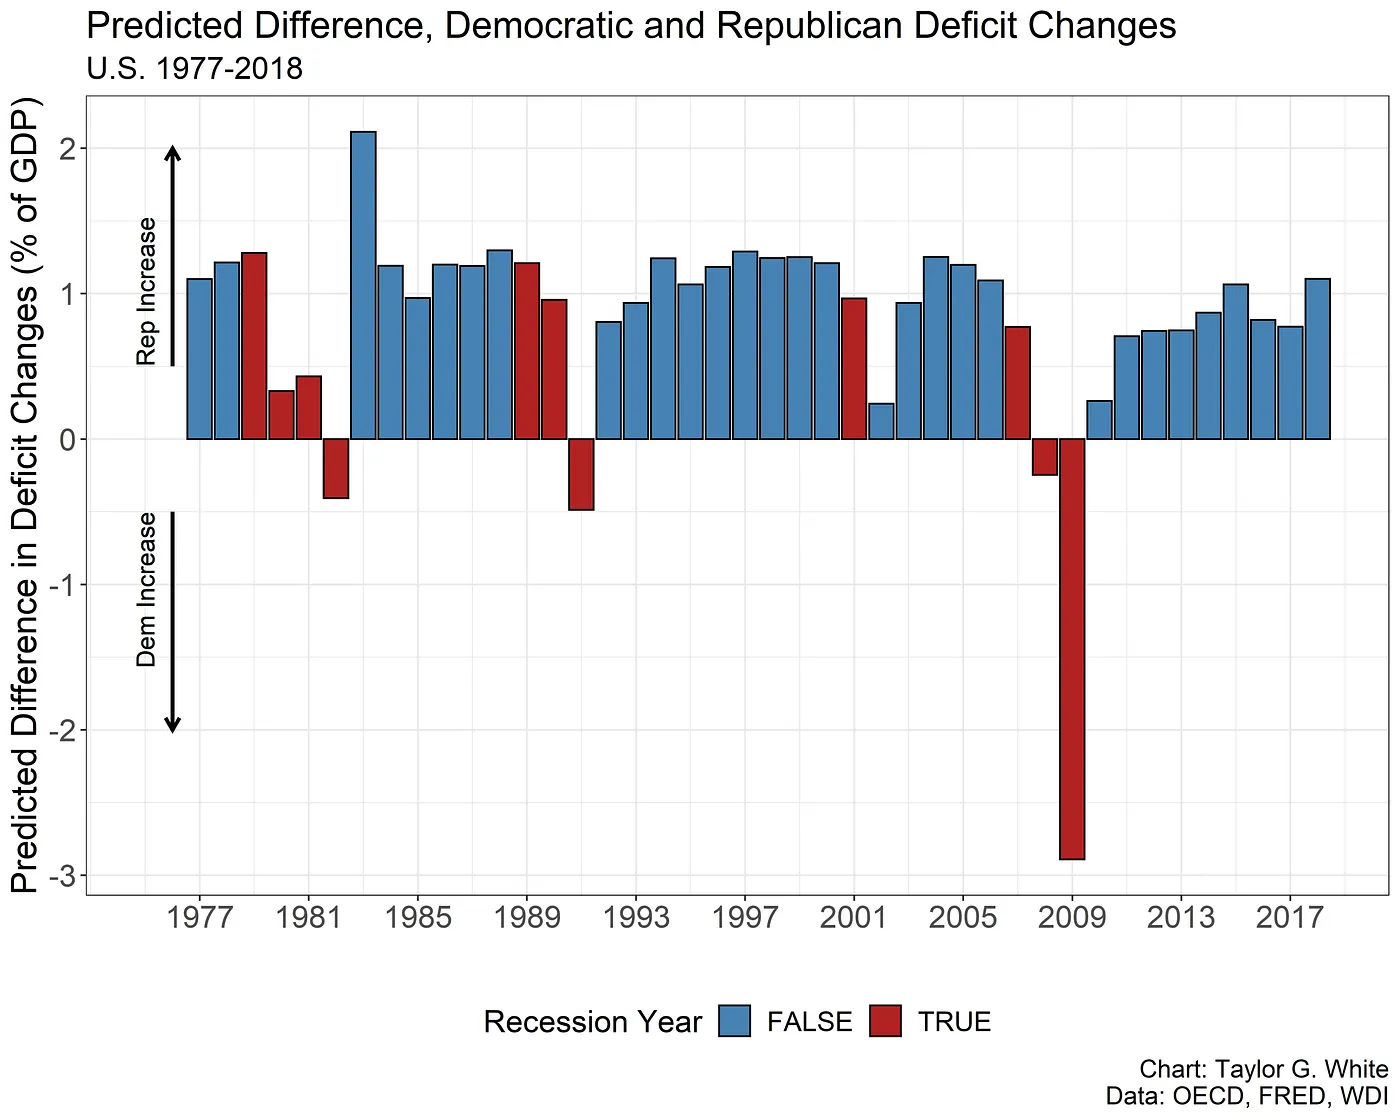
Overall, Republicans are expected to add to deficits most of the time. My interpretation is that Republicans are keen to cut taxes, but they aren’t as successful at cutting spending. There are a few situations when Democrats are expected to increase deficits more than Republicans though. The red bars show that there was officially a recession in part of that year. Overall, the red bars tend to be lower than the blue bars, because Democrats tend to respond more aggressively to poor economic conditions by increasing deficits. This effect is heavily influenced by Obama’s counter-cyclical policies, and in general, that year tends to be an outlier in the analysis because of the severity of the recession. Removing that year from the analysis doesn’t affect the overall conclusion that Republicans add more overall to deficits (in fact the point estimate increases), it just reduces the interaction effect.
Conclusion
The end-result is simple: Republican presidents add more to deficits than their Democratic counterparts.
There is a lot of nonsense said in election seasons and academics simply don’t have enough time to produce a peer-reviewed study to address politicians’ claims in a timely manner. This analysis is an attempt to address such claims in real time, using transparent data and methods that can be verified and reproduced by others.