What is a Life Cycle Assessment? LCA
Perform Life Cycle Assessment with Python to help businesses evaluate a product's environmental impacts over its entire life cycle.

As consumers become increasingly environmentally conscious, businesses must prioritize sustainability to remain competitive.
Life cycle assessment (LCA) evaluates a product's environmental impacts throughout its life cycle, from raw material extraction to disposal.
How much water is needed to produce my T-shirt?
The life cycle assessment aims to identify and quantify a product's environmental impacts for reporting purposes and to support sustainability initiatives.
How to use data analytics to estimate the environmental impact of the cheap t-shirt you bought in Zara?
You need data from multiple sources to track the impact of your products along the value chain until their end of life.
This article shows how data analytics can support Life Cycle Assessment (LCA) by extracting and processing data from multiple systems to perform diagnostics and simulate scenarios.
I. Assessment in four steps
  1. Goal and scope definition
  Define the goals and scope of this assessment.
  2. Inventory Analysis
  Gather data on the materials, energy, and other resources used
  3. Interpretation and evaluation
  Assessing the overall environmental performance of the product
II. Life Cycle Assessment for Advanced Reporting
  1. ESG reporting
  Report the Environmental, Social and Governance of your company
  2. Data Analytics to Fight GreenWashing
  Detect false claims of sustainability using public data
  3. Business Intelligence for LCA
  Methodologies to collect and process from multiple sources
III. Next Steps
  1. Simulate different scenarios with a Digital Twin
  What is the impact of localizing your production on your LCA?
  2. Conduct Further Analysis with Brightway2
  Open source librairies with publicly available databases
  3. Sustainable Supply Chain App
  Design the optimal manufacturing facilities to minimize CO2 emissions
  4. Automate Data Extraction from Excel files using Python
  Create a python script to extract data from utilities bills
Assessment in four steps
We assume you are a data scientist in a Fast Fashion retail company working with the sustainability department to implement automated sustainability reporting.
What do we want to achieve with Life Cycle Assessment?
Step 1: Goal and scope definition
To initiate our Life Cycle Assessment (LCA), we need to define the goals and scope of this assessment.
What is the environmental impact of producing and selling a t-shirt in a fast-fashion retail company?
This includes identifying the product being studied, the environmental impacts of interest, and the functional unit (the unit of measurement used to compare different products or services).
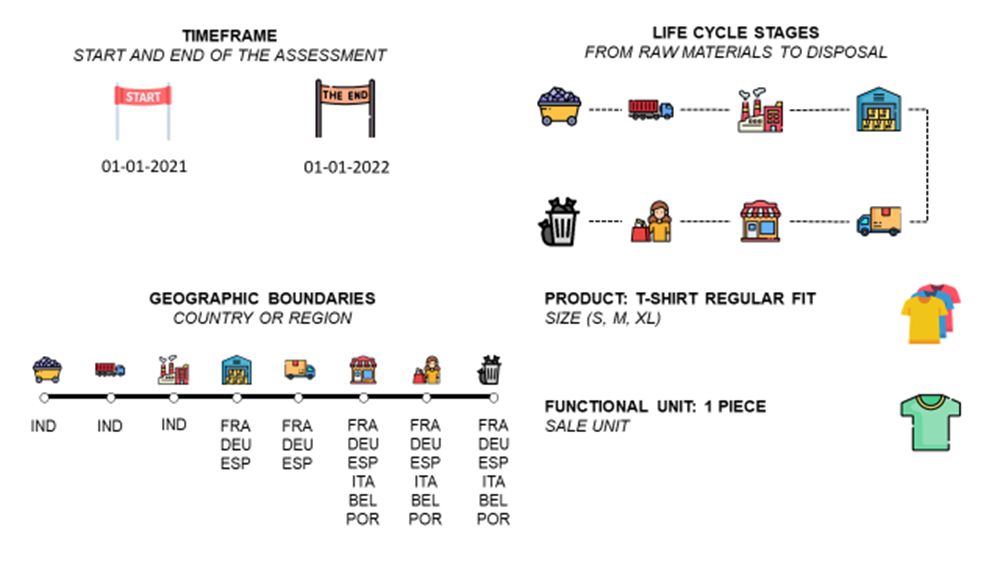
- Identify the product being evaluated and its intended use
Example: T-shirt Regular Fit including all sizes - Identify the specific life cycle stages of the product to be included in the assessment: from raw material extraction to disposal.
- Specify the geographic boundaries of your assessment: the locations of the production facilities, transportation routes, and final disposal.
Raw materials extraction and production in India
Storage, store delivery and disposal in Europe - Identify the time frame of the assessment: starting and ending dates of the assessment period.
From January 1st 2021 to January 1st 2022 - Define the functional unit, a standard measure to compare different products' environmental impacts.
1 unit of sales: a single T-shirt
Ensure that the scope is agreed upon by all stakeholders involved in the assessment.
This ensures that the Life Cycle Assessment results are meaningful and representative and will not be challenged.

The product will be linked to one (or several) SKU code(s) in your different systems (ERP, WMS, TMS)
- You may have several codes for the different sizes and colours of t-shirts.
- Codes can differ from one system to another (SKU Production Code, SKU in Sales Packaging, ..): Ensure you have consistent master data to track your items along the value chain.
From raw materials to finished products, your value chain involves warehouses, factories and freight operations.
For each life cycle stage, you may have different data sources/systems
- Production data can be found in your Production Management Systems or your Enterprise Resources Planning
- Transportation will be managed by Transportation Management Systems
- Warehouse Operations data are stored in a Warehouse Management System
- Sales (and after-sales) data can be extracted from your Point of Sales (POS) and Customer Relationship Management (CRM) systems
Raw materials are sourced in India for manufacturing in Bangladesh and retail in Europe.
Geographic boundaries can be defined by the source system and transaction information
- Raw material sourcing information can be found in the purchase orders created in the ERP
- Production locations information in the PMS (Factory, production line)
- Transportation locations are tracked in the shipment information in your TMS (Origin, Destination, Countries crossed)
Identifying the time frame can be challenging and will impact your assessment results
- Are we talking about all products sold in the time frame?
If yes, does that mean we have to look at production, transportation and warehousing activities that occurred before the starting date? - Or do we look at the activities in the time frame?
If yes, let’s look at the impact of production and transportation of products sold after the ending date.
Note that the scope could be more or less detailed according to your needs and the expected initiatives to benefit from the results.
What data do have on hand for this analysis?
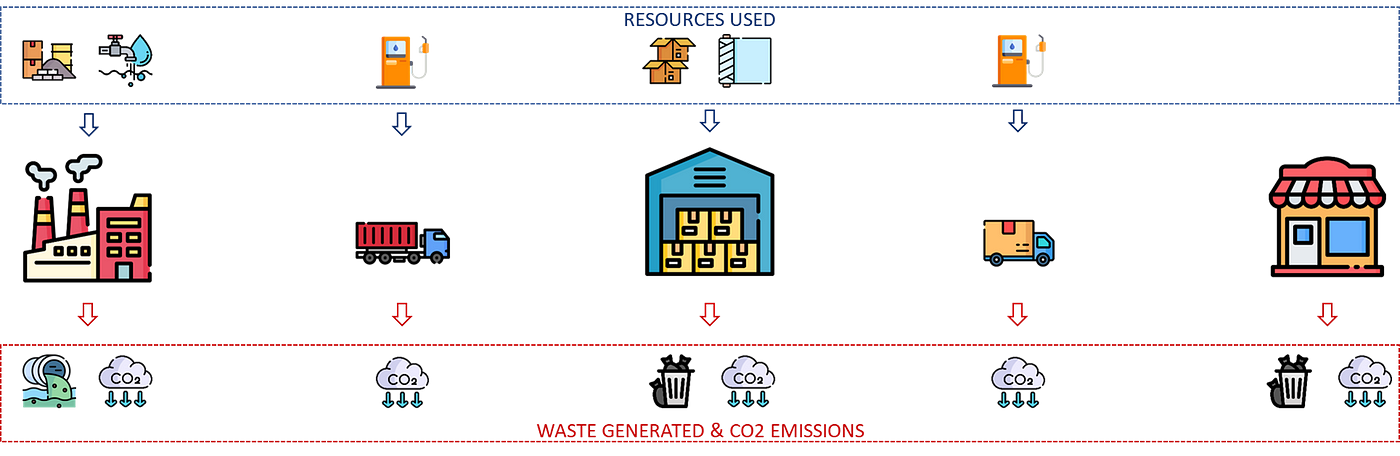
Step 2: Inventory Analysis
The second step is to gather data on the materials, energy, and other resources used and the waste generated throughout the product or service's life cycle.
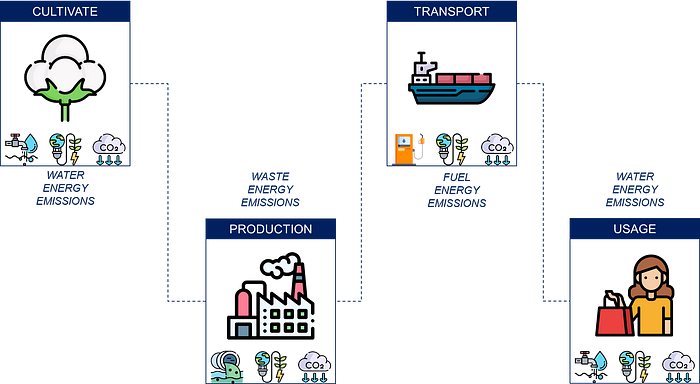
Raw materials
Your t-shirt is made of 100% cotton grown and processed in India

You can now quantify the CO2 emitted and the energy and water used per functional unit.
💡 Impact of Raw Material Cultivation
- We have 1kg of raw material = 1 functional unit.
- Quantities of cotton and utilities consumed can be estimated or measured by your suppliers.
What is the impact of raw materials transformation?
Production
The T-shirt is produced in your factories located in India

Transportation
Your t-shirt is produced in India and shipped to Europe by sea freight and road,

💡 Impact of your Logistic Network
- Sea transportation energy and emissions data are highly variable and depend on the vessel, time of year, and shipping route. Your freight forwarder should validate (or provide) these data.
- CO2 emissions of transportation can be estimated for the other transportation modes (route, air and rail) like in this example of CO2 emissions reporting methodology
- For water and electricity consumption, CO2 emissions, and generated waste, warehouse operations can also be considered.
What happens after the T-shirt is sold?
Usage and disposal
Your product is used (usage and disposal) in the market’s country.
The t-shirt is used for two years before being disposed of.
- Energy consumption for washing and drying: 100 MJ/t-shirt
- Water consumption for washing and drying: 500 L/t-shirt
- Emissions from electricity generation: 10 kg CO2e/t-shirt
The t-shirt is disposed of in a landfill in the country where it is sold.
- Emissions from decomposition: 5 kg CO2e/t-shirt
Great, now we have covered the entire life cycle.
Step 3: Impact assessment
Now that we have gathered data for each step, we can start evaluating the environmental impacts of the functional unit (1 t-shirt here) on
- Air, water, and soil
- Human health and ecosystem health
- Energy consumption: 870 MJ
58% consumed during the production - Greenhouse gas emissions: 46 kg CO2e
With a majority of emissions during production - Water consumption: 3,500 L
57% consumed during production - Solid waste: 0.5 kg
generated during production - Air pollution: 0.8 g of SOx and 0.5 g of NOx emissions
emitted during transportation
The majority of the impacts are generated during production and transportation.
Step 4: Interpretation and evaluation
This is assessing the product's overall environmental performance and identifying areas for improvement and potential mitigation strategies.

Comparison to industry standards
The impact assessment results can be compared to industry standards or benchmarks to see how the t-shirt compares to similar products regarding environmental performance.
Identification of hotspots
The impact assessment results can be used to identify the “hotspots” where the t-shirt has the most significant environmental impact.
In our example, these hotspots are greenhouse gas emissions and energy consumption during production and transportation.
💡 Diagnostic Analytics for automated identification
If you have implemented a data pipeline to gather, process and store data for your inventory, you can implement diagnostic analytics tools and methodologies to automatically
- Manage several thousand SKUs with different value chains
- Implement automated rules for monitoring, alerting and root cause analysis to answer questions like
Why did the CO2 emissions of SKU 132897–98 increase by 20%?
Potential mitigation strategies
Potential mitigation strategies can be developed based on the hotspots identified to reduce the t-shirt's environmental impact.
- Use renewable energy for production facilities.
- Localize the production to reduce the transportation distance between factories and markets.
- Partner with forwarders that use alternative fuels or own eco-efficient fleets to reduce the CO2 emissions per km
- Conduct studies for Supply Chain Network Optimization focusing on reducing the environmental impact by choosing the suitable suppliers and factory locations
Continuous improvement
The interpretation and evaluation results should be used to continuously improve the product's or process's environmental performance over time.
Of course, you must consider the trade-offs between the environmental impacts and other aspects, such as cost and performance, to reduce the business impacts.
💡 For more details,
Now that you have implemented a process for collecting and processing data to generate insights, you can build sustainability reports.
Life Cycle Assessment for Advanced Reporting
LCA for ESG Reporting
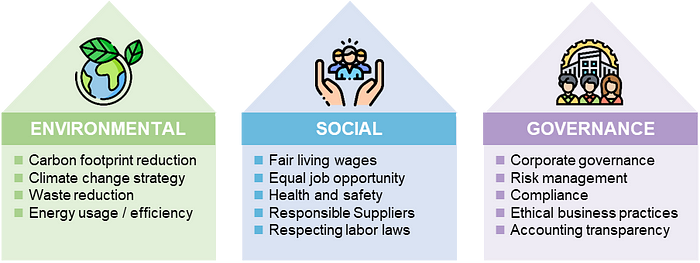
Environmental, Social, and Governance (ESG) reporting is a methodology corporations use to disclose their environmental footprint, governance structures, and societal impacts.
As stakeholders increasingly demand corporate social responsibility (CSR), reporting has become critical to companies’ long-term strategies.
How can you support ESG reporting with data analytics?
The core of Environmental (E) reporting lies under the life cycle assessment, as you need to report the impact of your products from raw material sourcing to store delivery.

The indicators under the environmental part depend on parameters that are included in the Life Cycle Assessment.
💡 For more details,
Have you heard about greenwashing?
What Greenwashing Is, and How We Can Use Analytics to Detect It
While you’re trying to accurately report the environmental impacts of your operations, other companies lie.
Use data analytics to challenge sustainability reports.
Some companies make misleading claims about a product's environmental benefits to communicate a false image of sustainability.

This practice of embellishing or hiding falsehoods as companies seek the attention of environmentally conscious consumers challenges organizations and governments.
Can we fight greenwashing with advanced analytics?

We can combine data science with Life Cycle Assessment methodologies to detect these frauds with
- Publicly available data: financial and sustainability reports, footprint databases, social media
- Advanced analytics models like NLP, forecasting or statistical models to detect fraud
💡 For more details,
What are the best practices for collecting and processing data from multiple systems?
Business Intelligence for Life Cycle Assessment
Business Intelligence is a process that leverages software and services to transform data into actionable intelligence supporting decision-making.

As your life cycle assessment relies on collecting and processing data from multiple sources, you need a method to implement an automated pipeline.
How can you automate the collection and processing of these data?
Instead of using estimation or average, you can build a data architecture to retrieve updated data and metrics in a data lake.

- The system that manages your factory may not provide information on energy, water usage, or waste generation per unit.
Use external sources like energy bills in Excel files - Your suppliers can provide energy and water usage for cotton cultivation in Excel reports that will feed your reporting
- Some freight forwarders have API(s) to extract routing information, emissions and fuel consumption per shipment
This architecture will reduce the amount of manual work and improve the accuracy of your reporting by using up-to-date parameters and input data.
How can use analytics solutions to create a central source of truth with harmonized data?
Business Intelligence tools combine various applications, including data warehousing, discovery, and visualization.

BI solutions interact with these systems to:
- Process and translate the acquired data into a single harmonized source
- Build user-friendly reports, charts and maps
💡 For more details,
After reporting, what’s the next step?
Your company may use the results and insights to implement a sustainability roadmap with initiatives.
In the following section, we will see how data can be used to simulate the impact of these initiatives.
Next Steps
This article mainly focused on how data analytics can support data gathering, processing and visualization with diagnostic tools.
What if we want to estimate the impact of reengineering solutions?
Simulate different scenarios with a Digital Twin
A digital twin is a digital replica of a physical object or system.
This model represents your warehouses, transportation networks, and production facilities.

In this digital world, you can model each element of your end-to-end supply chain with costs, energy, emissions and lead time parameters.
What if we deliver European market from a warehouse in UK?
When brainstorming potential decarbonisation strategies, you can simulate their impacts on the supply chain.

For example,
- What would be the impacts on logistic costs and CO2 emissions if we localize the production?
- What would impact your inventory and store delivery lead time if we use alternative (green) cultivation methods outside India?
- What would be the costs of implementing a logistic network to collect used items at stores?
For more details on how to implement this solution,
Have you heard about Supply Chain Optimization?
Sustainable Supply Chain Optimization App
Sustainable supply chain optimization is an approach to network design that combines cost-effectiveness with environmental responsibility.

What is the optimal set of factories to minimize CO2 emissions?
Suppose you want to design a supply chain network to produce and deliver products to specific markets.
You have
- The demand per market in (Unit/Month)
- A set of potential factories with their fixed/variable costs, environmental impact and locations
- Transportation costs and environmental impacts from the factories to each market
What would the cost impact be if we want to minimize CO2 emissions?

With this solution, you can simulate several scenarios, playing with the objectives (e.g., minimizing CO2, cost, or water usage) to get the optimal network.
I developed a web application that simulates several scenarios of green transformation to estimate the impact on the overall cost of production.
For more details,👇
What about unstructured data?
Automate Accounting Tasks using Python
As explained in the previous section, we may need to extract information from unstructured data like Excel files.
For instance, your utility bills may be in Excel files.
How can we automatically extract and process information from these Excel files?
In another article, I share my method for automatically extracting and processing data from an Excel file using Python.

The approach is simple: your Python script will automatically open files (that respect a specific template) to extract and process data used to build a report.

Like the example above, these files can be your utility bills or supplier invoices.
The output can be used to generate reports or feed an SQL database.
For more information about this methodology, check the article linked below. 👇
About Me
Let’s connect on Linkedin and Twitter. I am a Supply Chain Engineer who uses data analytics to improve logistics operations and reduce costs.
For consulting or advice on analytics and sustainable supply chain transformation, feel free to contact me via Logigreen Consulting.
If you are interested in Data Analytics and Supply Chain, look at my website.
💌 New articles straight in your inbox for free: Newsletter
📘 Your complete guide for Supply Chain Analytics: Analytics Cheat Sheet
References
- “What is Supply Chain Analytics?”, Towards Data Science, Samir Saci
- “4 Impacting Projects to Start Your Data Science for Supply Chain Journey”, Towards Data Science, Samir Saci
- Sustainable Logistics — Reduce Warehouse Consumables, Personal Blog, Samir Saci