Fourier Transform, Applied (2): Understanding phase angle
Understanding the basics of FFT phase
In the previous post, the visualizations exclusively addressed the magnitude of the Fourier transform. Here, we will expand on the missing piece: phase!
Check out the previous articles in the series!
In the previous post, I showed how the magnitude of the Fourier transform could be used to estimate the frequency components of a signal. With just frequency, though, we can’t perfectly reconstruct a signal; we need phase!

What if we look at a pure tone audio file, but we shift the signal left to right?
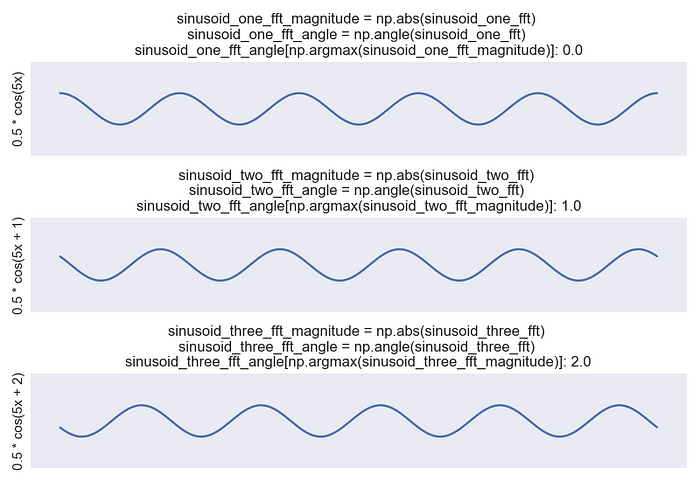
In our previous audio example, this presents a challenge. All three of the signals to the left (Figure 1) have the same frequency. The rate of oscillation between high pressure and low pressure is the same. The only difference is the starting position, shifting left to right.
We can express this as a “phase shift.” The three signals are the same frequency, just offset in the starting position in the oscillation. Looking at the three generating equations, respectively — 0.5 * cos(5x), 05 * cos(5x + 1), and 0.5 * cos(5x + 2) — this offset is expressed as the summed value in the cosine expression, i.e. 0, 1, and 2.

This phase information is also expressed in the Fourier transform and can be recovered with the numpy “angle” function. If we look at the phase value at the same index as the frequency with the maximum magnitude, we can identify the phase offset associated with that frequency component. Here (Figure 2), the Fourier transform recovers 0, 1, and 2 from the equations above!
Give the article a clap if the repo or text were valuable to you! Thanks for reading!

