Supply Planning using Linear Programming with Python
Where must you allocate your stock to meet customers' demands and reduce transportation costs?

Supply planning is managing the inventory produced by manufacturing to fulfil the requirements created from the demand plan.
How many pallets do we need to ship to the DC1 for the next month?
Your target is to balance supply and demand to ensure the best service level at the lowest cost.
As a data scientist, how can you automate this process?
In this article, we will present a simple methodology to use Integer Linear Programming with Python to answer a complex Supply Planning Problem considering:
- Inbound Transportation Costs from the Plants to the Distribution Centers (DC) ($/Carton)
- Outbound Transportation Costs from the DCs to the final customer ($/Carton)
- Customer Demand (Carton)
SUMMARY
I. Scenario
As a Supply Planning manager you need to optimize inventory allocation to reduce transportation costs.
II. Build your Model
1. Declare your decision variables
What are you trying to decide?
2. Declare your objective function
What do you want to minimize?
3. Define the constraints
What are the limits in resources?
4. Solve the model and prepare the results
What are the results of your simulation?
III. Conclusion
1. Generative AI: Supply Planning GPT Agent
2. Simulation with a Supply Chain Digital Twin
How do you optimize Supply Planning with Python?
As a Supply Planning manager of a mid-size manufacturing company, you received feedback that the distribution costs are too high.
Based on the analysis of the Transportation Manager, this is mainly due to the stock allocation rules.
What is the root cause?
Sometimes, your customers are not shipped from the closest distribution centre, which impacts your freight costs.
Let’s understand why!
Your Distribution Network
- 2 plants producing products with infinite capacity
Note: We’ll see later how we can improve this assumption easily - 2 distribution centres that receive finished goods from the two plants and deliver them to the final customers
Note: We will consider that these warehouses operate X-Docking to avoid considering the concept of stock capacity in our model - 200 stores (delivery points)
To simplify the comprehension, let’s introduce some notations

What drives the demand?
Store Demand
What is the demand per store?

How much does it cost to move goods?
Transportation Costs
Our main goal is to reduce the total transportation costs, including inbound shipments (from the plants to the DCs) and outbound shipments (from the DCs to the stores).


Question
Which Plant i and Distribution n should I chose to produce and deliver 100 units to Store p at the lowest cost?
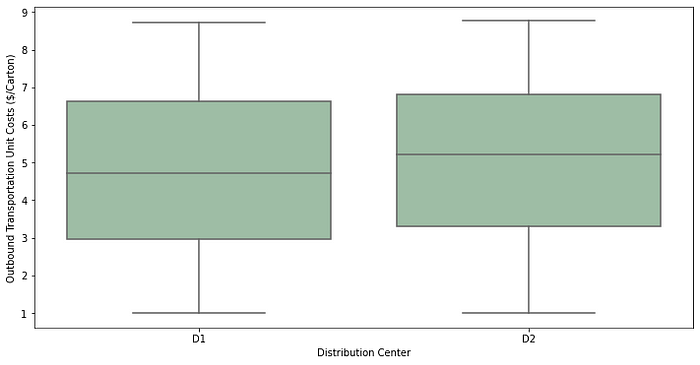
Comment
The box plot above shows that the D1 distribution of Unit Cost has a median value lower than D2.
What’s the impact?
Therefore, we expect the model to direct a significant part of the flow through D1.
Let’s explore that in detail in the next section.
🏫 Discover 70+ case studies using data analytics for supply chain sustainability🌳and business optimization 🏪 in this: Cheat Sheet
Build your Model
We will be using the Python PuLP library.
PuLP is a Python modelling framework for linear (LP) and Integer Programming (IP) problems.
How do we start?
Declare your decision variables.
What are you trying to decide?
We want to decide the quantity of Inbound and Outbound transportation.
What do we want to achieve?
Declare your objective function
We want to minimize the objective functions.

We want to decide to minimize the inbound and outbound transportation costs.
However, we are limited by constraints.
Define the constraints
What are the limits in resources that will determine your feasible region?

The Supply from DCs needs to meet the demand per store.
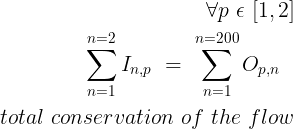
We don’t build any stock in the X-Docking platforms.
Can we add more constraints? Yes!
To keep the model simple, I only included volume constraints.
However, as business sustainability becomes a strategic topic in any company, we can include environmental constraints.
Including the environmental impact in your optimization problem is a great way to support your company's green transformation.
- Maximum CO2 emissions per km driven?
- Minimum truck fill rate for the store delivery
I won’t touch this topic here, but you can find more details in this article
Now that we have our constraints and objective function ready, let’s solve.
Solve the model and prepare the results
What are the results of your simulation?
The model takes the cheapest route for Inbound by linking P2 with D1 (resp. P1 with D2).
As expected, over 90% of the outbound flow goes through D1 to minimize Outbound Costs.
163 stores are delivered by D1
0 store is delivered by the two warehouses together
You can find the full code in this GitHub repository
💡 Follow me on Medium for more articles related to 🏭 Supply Chain Analytics, 🌳 Sustainability and 🕜 Productivity.
Conclusion
Using linear programming with Python can help supply planning managers optimize their distribution network and reduce transportation costs.
We can quickly adapt the model if we change the conditions and constraints.
The model presented here can be easily improved by adding operational constraints:
- Production Costs in Plants ($/Case)
- Maximal X-Docking Capacity in Distribution Centers (Cartons)
But also by improving the cost structure by adding
- Fixed/Variable Costs Structures in Distribution Centers ($)
- Fixed + Variable Transportation Costs Structure y = (Ax +b)
The only limit you will find is the linearity of the constraints and the objective functions.
Have you heard about Generative AI?
Generative AI: Machine Learning x GPT
As I wanted to understand the trend of Generative AI with large language models (LLMs), I started experimenting with its usage to improve user experience.
User: How many orders have delivered late?
Therefore, I built a smart agent with Langchain connected to a TMS that answers questions by querying a database.

This greatly improves the user experience compared to a static, boring dashboard built with PowerBI.
What if we create a super agent for Supply Chain Optimization?
The idea would be to equip a GPT agent with
- Advanced optimization models are written in Python in a core module
- Documentation, articles and context to understand how to use them

We can imagine an agent interacting with the supply planning.
User: What if we increase the capacity of Plant P1 by 25%?
For more details on how to implement it,
Have you heard about Digital Twins?
Simulate different scenarios with a Digital Twin
A digital twin is a digital replica of a physical object or system.
The model built here only focuses on the transportation flows between the factories, cross-docking platforms and stores.
What if we want to simulate the processes inside the cross-docking platforms?
A Supply Chain digital twin is a computer model representing various components and processes involved in the supply chain, such as warehouses, transportation networks, and production facilities.

In this case, we can use it to simulate several scenarios for cost reductions or decarbonisation of this distribution network.
What if we add set up a local warehouse to reduce the last-mile delivery distance?
- Estimate the impact on the service level
- Calculate the new warehousing costs (with more locations)
- Predict the CO2 emissions reduction we can reach
Can we use it to optimize our supply chain?
For each scenario, you can manipulate the parameter linked to the initiative and see how much your overall performance will decrease.
Then, you can adapt the other metric (warehouse capacity and locations, replenishment lead time, etc.) until you reach the target.
For more details, have a look at this article
You will also find a simple example of a digital twin used to simulate multiple inventory management strategies for reducing carbon emissions.
About Me
Let’s connect on Linkedin and Twitter. I am a Supply Chain Engineer who uses data analytics to improve logistics operations and reduce costs.
For consulting or advice on analytics and sustainable supply chain transformation, feel free to contact me via Logigreen Consulting.
If you are interested in Data Analytics and Supply Chain, look at my website.
💌 New articles straight in your inbox for free: Newsletter
📘 Your complete guide for Supply Chain Analytics: Analytics Cheat Sheet

