Covid-19 — anatomy of a methodology crisis. It all starts with data collection
Surveys of prevalence and severity are necessary tools to monitor COVID and make robust decisions with ease and transparency.
Abstract: Without reliable measures of prevalence (viral circulation) and severity (the probability that infections lead to severe forms such as hospitalisation), the medium-term impact of viral circulation cannot be assessed robustly. A random survey of prevalence and associated severity would greatly robustify current research efforts, facilitate decision-making, and foster transparency in public policy, for annual costs possibly under one million euros.

Authors:
- Samuel j. Sender (CEO, squareyourdata; associate professor, Edhec) — idea and writing
- Mircea Sofonea (Associate Professor in epidemiology and evolution of infectious diseases, Uni Montpellier) — use of data in epidemiologic modelling in Montpellier and Europe
- Pierre Sonigo (chief scientific officer of Sebia laboratories) — immunological theory, sensitivity and interpretation of lab measurements such as PCR tests and serological surveys
We thank Jacques Cohen (immunologist, emeritus professor, Uni RCA) for insights on possibilities to deploy cheap medical testing kits for surveys, Yves Fradier (head of large-scale surveys at Kantar Public) as well as contacts from the French statistical institute for their practical insights into the implementation of the surveys we do recommend; Minh Trinh (partner at Rodeo AI) and Yann Coatanlem (president of the Praxis Think-Tank) for their suggestions and proposal to further push this message.
Note: prevalence is the fraction of people currently infected, and can be thought as the population-wide positivity rate; incidence refers to newly infected persons.
Introduction
The naive view that sophisticated models can be applied regardless of the data quality explains why institutions with deep pockets neglect data collection.
Yet the best efforts of modelers are hampered by data quality and relevance to answer a given question. Lack of reliable data leads to less robust model output, and in turn in practice to more debatable conclusions than desired, even possibly to distrust in public action.
Deep pockets, at financial conglomerates, international institutions, and governments, provide incentives to develop sophisticated models that potentially can use a variety of data sources, but robustness is not a characteristic of models on their own, but the ability to draw unambiguous conclusions to a question with the dataset and models at hands. Although parsimony is thought as a desirable model attribute to test simple models or hypotheses, a parsimonious model without robust data may not lead to robust predictions. Although data abundance and modern, complex models enable new insights or signals, sophistication has not prevented bankruptcies of financial conglomerates. In fact, unmanaged complexity is one of the causes of the 2008 financial crisis (see Greenspan, 2013 and the IMF’s 2008 Global Financial Stability Report).
In the case of the COVID epidemic, the poor measurement of two fundamental variables, prevalence and the severity of infections, leads to non-robust predictions regarding the medium-term impact of viral circulation or any policy related to viral circulation. It thus appears necessary to robustify the current research effort with sound and reliable data collection. Our proposal involves a random survey of prevalence.
Such a survey will permit tracking the viral transmission more precisely and for a cheaper cost than today. As a matter of fact, we reckon it can be implemented in each country or state with costs starting below one million euro per year. It will permit the monitoring of prevalence and severity in an unbiased way for the first time. The impact of viral circulation and governmental measures will be assessed in a transparent and non-debatable way. In turn, this will facilitate not only decision making but also communication and readability of public policies. This will foster transparency and confidence in vaccination campaigns and non-pharmaceutical interventions (such as quarantine).
This approach can be replicated at the relevant administrative or geographical level (region, state, or country).
I) A problem starts with a question and a model overview
Monitoring needs
The two essential components of the COVID epidemic can be summarised as the viral circulation (number of new infections) and its health impacts, both for individuals and for public health systems.
A fraction of new infections will lead to hospitalisations. This fraction, one possible measure of the severity of infections, may fluctuate (potentially in either way, see below). It thus must be monitored.
That the severity of infections varies in time is particularly true for the respiratory viruses, whose circulation can hardly be stopped.
With insights from the theory
For the population, the average severity of viral infections evolves in time, potentially increasing or decreasing with viral mutations, and always decreasing with the rise in immunity that results from previous viral circulation. It cannot be assumed constant and thus must be monitored.
Regarding immunity, it is essential to distinguish between immunity in the upper respiratory tract (“the nose”), and immunity of the lower respiratory tract (lungs as well as other internal organs).
- Immunity of the lower respiratory tract (the lungs and other internal organs), is efficient against severe forms, is long-lasting, and can be called systemic immunity for concision.
- Immunity of the upper respiratory tract, which would be needed to stop viral circulation, is weak and short-lived, notably because mucosal tissues in the nose are both exposed easily to aerial viruses and poorly protected. It can thus be said that there is no long-lasting mucosal, stopping or sterilising immunity.
The rise in systemic immunity does not fully prevent reinfections of the upper respiratory tract and further viral transmission, but reduces the probability of severe infections (of internal organs). It thus implies a much greater fall in the severity of infections than in new cases.
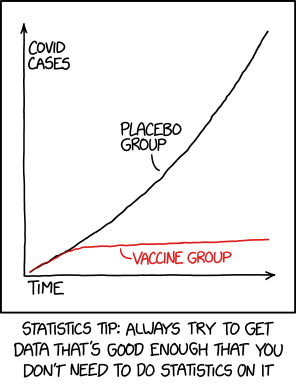
The very same phenomenon happens with vaccines, which prevent severe cases, but only have a partial effect against viral circulation and reinfections. Our World in Data shows that new cases are currently much higher in the UK than in most less vaccinated countries; new cases have been similar in the heavily vaccinated Chilean population and its neighbouring poorly vaccinated Brazilean population. Hospitalizations, ICU and confirmed deaths have been much higher in countries where vaccination has been lagging (Brazil and France) relative to their better vaccinated neighbours (Chile and the UK).
The empirical severity may however potentially vary in either way, depending on the intrinseque strain virulence, hospital overload and for the aggregate, the age-structure of infections, exposure and vaccination (which must be controlled for). It tends to decrease with immunity, acquired either from exposure to the virus or from vaccination rollout.
II) The data collection: clear data trumps complex analyses
Using carefully designed surveys and experiments
Models are necessary for what cannot be observed — for example, the future. Often, the important parameters needed to characterise the current situation can be directly estimated with observations and measurements.
Robust data collection permits to answer some relevant questions regarding the current and past situation.
The data collection must be organised before-hand to permit an extremely clear assessment.
Traditional data collection methodologies involve repeated surveys, ideally with the same individuals — this is called longitudinal or panel data — to make sense of both individual and collective changes.
In fact, surveys, and the design of experiments (Fisher, 1935) are widely recognised as essential to collect information and test hypotheses. The United Nations’ Fundamental Principles of Official Statistics states that “data for statistical purposes may be drawn from all types of sources, be they statistical surveys or administrative records”
Governments perform regular surveys to monitor the popularity of their actions; thousands of surveys are performed monthly to monitor the economic activity, prices of consumers’ and industrial goods, and public opinion on a wide range of issues. But astonishingly, no such survey has been performed regularly for CoViD infections, the severity of infections, and immunological defences in the population.
An illustration of surveys
Simple, cheap, yet powerful analyses mainly require a relevant question and the robust collection of informative data by means of surveys.

To gather information from the (target) population as a whole, the key is that the sample must have the same characteristics as the population. This happens when people are randomly selected, but this does not happen when people self-select (as with PCR tests, social media posting,…).

This does not happen when people self-select (as with PCR tests, social media posting,…).
In fact, estimating the circulation of the virus on the basis of self-reported tests is akin to estimating the probability of a Biden or a Trump victory by counting their Twitter followers rather than by usual population surveys. It’s neither standard nor robust statistical methodology.
The usual reasons for poor data collection are the lack of clearly spelled (prior) objectives or descriptions of the analyses that the data will feed. Monitoring and modelling of the Sars-CoV-2 arguably necessitates robust data collection.
III) Feeding models correctly
The need to evaluate measurements
Very short-term forecasts of new infections and of new hospitalisations rely on:
- a measure of current infections
- a measure of their severity, ideally with a clinical follow-up, but with minimal cost by the probability of hospitalisation
- (for forecasts beyond a month, the speed of viral reproduction is also needed)
Longer-term models, useful to policy, must focus on the characteristics of the population, and notably should measure:
- total infections
- evolution of immunological defences and the severity of infections.
Infections being a crucial input to all forecasts, what can be inferred from statistical protocols and medical measures must be carefully reviewed. Feeding the model with inaccurate data may lead to inaccurate predictions, which can be biased (false), noisy, or even uninformative.
To better understand the bias in measures of infection, let us review the two main (partial) measures:
- Current or new infections are typically measured with PCR, and more recently, antigenic tests, which in most countries have been in use since May 2020 and scaled up after summer 2020.
- Serological surveys, designed to measure the build-up of Sars-CoV-2 specific antibodies, are sometimes taken as a proxy of immunity against Sars-CoV-2 (that is, of viral severity).
These two measures are however biased, which naturally makes the modelling exercise much more complicated.
Both measures are biased from a theoretical standpoint:
- PCR testing is a biased measure of the prevalence rate because testing is voluntary: by definition, those infected individuals who do not test are not counted in the results (see Sender, 2021 for a more detailed review of the biases).
- Serological surveys are not a measure of prevalence but have been deployed in spring 2021 in the absence of previous measures of prevalence. They are designed to be a proxy of past cumulative exposure, but this proxy can neither be timely (antibodies are build up with time) nor precise: antibodies are only one of the possible responses against SarS-COV-2, and furthermore they may fade with time.
There are also counterfactuals:
- The share of asymptomatic persons in voluntary PCR tests is far lesser than the share of asymptomatic positive persons in random PCR surveys (according to Petersen and Phillips 2020, 75% of infected persons are asymptomatic). This proves under-detection in PCR tests: because testing is voluntary, asymptomatic infected persons tend to test less than symptomatic.
- While serological surveys do not permit to track viral circulation (the prevalence), they equally do not permit to track immunity. The extremely low rate of severe hospitalisations and deaths amongst persons less than 30 years of age proves that systemic immunity can be acquired before exposure.
Soundly designed statistical surveys, however, have neither been used to estimate new cases nor to monitor the severity of infections. These two fundamental indicators of epidemic developments, unmeasured, must then be replaced with non-robust model-based estimates, or with the assumption that the severity of viral infections is fixed.
The impact of poor data collection in public forecasts
Forecasting hospitalisations and deaths require estimates of the viral exposure and of an implicit severity — the ratio of new deaths or new hospitalisations on new infections.
Monitoring the propagation of Sars-CoV-2, and the evolution of its severity would have been very simple with regular and reliable surveys of new CoViD infections (referred to as incidence or exposure).

Because this crucial parameter of epidemiologic models has not been explicitly measured, assumptions must be made about it.
This makes models less robust than what they could be. While a precise measure of prevalence is stricto sensus not necessary to predict hospitalisations, prevalence and severity are key to determining optimal public policies regarding viral circulation.
The absence of a robust measurement of prevalence and severity, and the necessary use of assumptions regarding severity in models, may contribute to explain why government policies have varied greatly around the world.
IV) A call for better data collection.
Do for the COVID as you would do for others.
Overall, random surveys and longitudinal studies are customary in daily economic life; matched (anonymously) with administrative data, they provide a wealth of information. The sample prevalence survey we recommend can be matched automatically with hospitalisation data, but also wages to assess the economic impact of COVID contamination. The need for an organised data collection is astonishingly obvious.
For COVID, we recommend a clear assessment of the two most important drivers of infections, the viral circulation (new infections) and their severity, which can be assessed as follows:
- Monitoring new cases simply requires regular PCR surveys.
- Severity for the overall population can be estimated by the ratio of new hospitalisation to new cases
- This measure can be refined and supplemented with the collection of the severity of symptoms associated with infections, as well as the viral concentration measured in tests. After all, the fraction of asymptomatic infections also is a proxy of the rise in systemic immunity (by definition, someone infected but without any disease has immunological defences)
- Naturally, the information on all tests should also be formally linked to the patient characteristics (age and health condition) as well as to the hospitalisation data.
- In such random, smaller population surveys, severity must ideally be measured in three or four age groups; depending on whether costs need to be minimised or not, various options can be considered in that respect.
Collecting this information is still important, notably because respiratory viruses have an environmental component. Clean data yields transparent information, permits robust assessments of the evolution of Sars-CoV-2, which is needed in all aspects of economic life, also for informed policy debates and decisions, as long as the Sars-CoV-2 is perceived as a potential threat.
Practical recommendation for rapid and efficient implementation.
1) The organisational difficulty
One of the practical difficulties in implementing such surveys lies in the perceived need to coordinate statistical and medical institutes.
Statistical institutes possess the population databases that permit the design of representative surveys, with different levels of stratification.
Health institutes possess the medical expertise to interpret tests yet are not customary with population-wide surveys.
Some of the serological surveys performed in spring 2020 involved the two institutes in a relatively inefficient way: the results were often published several months after the data were collected.
2) The possibility of direct, efficient action
The availability of auto-tests facilitates the implementation of surveys by a unique institute. In order or priority, we recommend:
- In the interest of speed, one can rely on market research firms to deploy online surveys (possibly supplemented with one face-to-face computer-assisted interview), where each selected respondent would receive (or fetch in any laboratory or pharmacy) testing kit, which results he would report every week. The testing kit would involve either an antigenic test or a quick serological test.
- Over the long run, a representative cohort could be designed, with regular serological tests where blood samples would be examined at laboratories.
3) Representative surveys in the world
Although population-wide representative surveys are customary for all aspects of economic life, they have been seldom used for COVID around the world.
The best example of a population-wide representative survey is that conducted in the UK by the ONS, the COVID-19 Infection Survey data (ONS, 2020). This survey has amongst others permitted Petersen and Phillips (2020) to reckon the population percentage of asymptomatic positive PCR persons. Even in the UK, the mainstream estimate of prevalence (total number of cases) such as visible in the government dashboard are the number of positive tests conducted in all laboratories, rather than the ONS public representative survey.
In the US, some very specific publics have been surveyed in the CDC CoViD 19 surveillance project, notably fragile populations (pregnant women, retirees), but no population-wide representative survey has been conducted for prevalence and incidence.
4) A review of costs
The cost of tests is negligible compared to the cost of the surveillance system already deployed (see the following subsection for a few technical details).
We mainly comment on the costs of tracking viral circulation. This measure would permit tracking the evolution of severity in time and in real conditions, which would arguably be more informative than serologies which do not give information real-time because antibodies build-up after a couple of weeks.
- Measuring viral circulation would cost less than €1M per year, that is, €0.5M for the period of intense viral circulation
Today, the only measure of viral circulation is the fraction of those who decide to test against CoViD. A survey of the viral circulation in the population as a whole would cost in the order of 0.75 million euros per year.
These 0.75 million contrasts with the development and deployment cost of CoViD-tracking apps in the order of 10 million euros.
This survey can be performed online from a sample of a thousand persons, with antigenic auto-tests available from the local drug store (auto-tests cost approximately 10 euros to produce and can be bought for 5 euros).
- Tracking viral circulation in a cohort would cost €1M to €1.5M per year, that is, less than €1M for the period of intense circulation
A cohort survey would be richer and permit for instance to track the occurrence of reinfections in the population. In turn, this permits for instance to evaluate the protection given by vaccines against reinfection and viral circulation — this is not formally possible today because the probability of reinfection amongst non-vaccinated persons is not measured.
Cohort surveys, however, are slightly more problematic because of the usual attrition rate.
Attrition risk can be reduced by face-to-face interview, with the distribution of auto-test kits, a motivational speech, and an explanation of the procedure is typically needed. Extra cost: €200 k.
Attrition risk can also be reduced by two external devices. Firstly, governments and public health officials can underline the importance of commitment (to enable monitoring health dynamics in time); secondly, quasi-monetary incentives (purchase vouchers). Extra cost: €200 k to €600 k.
5) Survey cost components, a quick review
The costs provided below are purchase costs. The production cost, in particular for tests, is an order of magnitude smaller. The practical implementation cost estimates can thus be reduced by either scale purchases and collaboration.
The standard, purchase costs can be split as follows:
- testing kits: an antigenic test costs can be bought for €5 to €10 euros; PCR tests are thought as more reliable and could easily be deployed as self-testing (with nose-wash techniques); alternatively, genomic tests could be deployed (these are not available at large at the moment).
- online survey deployment costs come very cheap, with essentially fixed implementation and analysis costs and virtually no per head cost.
- overheads can help diminish the attrition rate.
- preliminary one-hour face-to-face interviews would cost about €200k for 1k persons, and €1M for 10k persons. There are indeed fixed costs (organisation, training).
The necessary sample size depends on the needed precision. The formula for the variance is p *(1-p) / N, which decreases with the sample size N but increases as the true proportion p approaches 50%.
The desired sample size can be obtained with the formula N=p_cent * (1-p_cent) / V_target, where p_cent is the most central prior probability and V_target is the target variance (the square of the target standard deviation).
To measure current infections with a standard deviation of 1%, given that prevalence is not likely to be above 10%, 900 persons would suffice; a standard deviation of 0.5% (where the precision would be said to be plus or minus 1%) could be reached with 4 times as many persons so that 10 k persons would suffice.
These basic calculations are valid for a population (or the category surveyed). Detailed results amongst age groups and regions naturally require more data. Six regions require less than 6 times more data though, because the regions correlate, so one region gives information about others.
V) Conclusion: simplicity in action trumps complexity
Large-scale surveys permit the gathering of detailed information across space (such as states, regions, cities) economic and sociological characteristics (age, economic activity) but also importantly to qualify interactions.
Such large-scale surveys are not only costly, but they also may be organisationally challenging given the involvement of culturally different institutes.
In the short run, it does not seem over-ambitious to require at least one precise measure of the circulation of the Sars-CoV-2 in the population.
Because Sars-CoV-2 is still perceived as an important risk, relevant monitoring of viral circulation must be implemented before periods of intense circulation. In the Northern hemisphere, respiratory infections tend to rise in October and fade in April — the current situation arguably (still) necessitates monitoring the rest of the year.
Monitoring viral circulation from October 1st to April 30th would cost half a million euros and guarantee better monitoring of viral infections and ensure sound, rational and easy to communicate public policy responses.
A cohort survey that would measure the probability of reinfection of vaccinated and non-vaccinated people would cost 1 to 2 million euros for the contagion period.

Note from the editors: Towards Data Science is a Medium publication primarily based on the study of data science and machine learning. We are not health professionals or epidemiologists, and the opinions of this article should not be interpreted as professional advice. See our Reader Terms for details. To learn more about the coronavirus pandemic, you can click here.

