Plotly Dash App
Building a Plotly Dash App from Google Sheets — Part 1
A non-traditional Dashboard built with well known and free tools
Introduction
Dashboards are still an incredibly popular task given to a data scientist or analyst in most firms. In a perfect world, you might connect to big streaming data pipeline or set up an individual Data Warehouse with OLAP cubes to feed a complicated set of real time analytics. Then build some beautiful flexibility into the app for the business teams to use for ad-hoc numbers. Maybe you even add in some flare with a few prediction algorithms augmenting the data. That sounds like a lot of fun. This is not that dashboard.
Alternatively, sometimes you need to build a dashboard around an existing set of processes and do very little to disturb the business. That’s where this dashboard lands. The idea with this project is to support a team of field marketers working for a fictional bicycle company. Each marketer hosts physical events around the country and needs to report on the type, size and frequency to the head of marketing. Additionally, these metrics need to track the progress toward a bonus incentive given to the employees. This fictional big company is one with a lot of red-tape, departments inside of departments and an overworked IT team. So, the head of marketing is game for a very simple solution that can completed in a few days that doesn't require sitting in 3 budget meetings to be approved or training the field staff on a new tool.
Enter Google Forms and Sheets. Rather than create another production level data store and web form to ingest data, we will use the simple, free and very familiar tools from Google. This allows for quick adjustment and editing of data by the team. And, as you’ll see, Google has given access to some of the same code they use to build the G-Suite in order to make our own customized solutions.
This project will be broken up into 4 parts.
- Design and ETL Process using Google and code.gs
- Connect the Google Sheets Data to python
- Build a Plotly Dash app
- Host it on Heroku [coming soon]
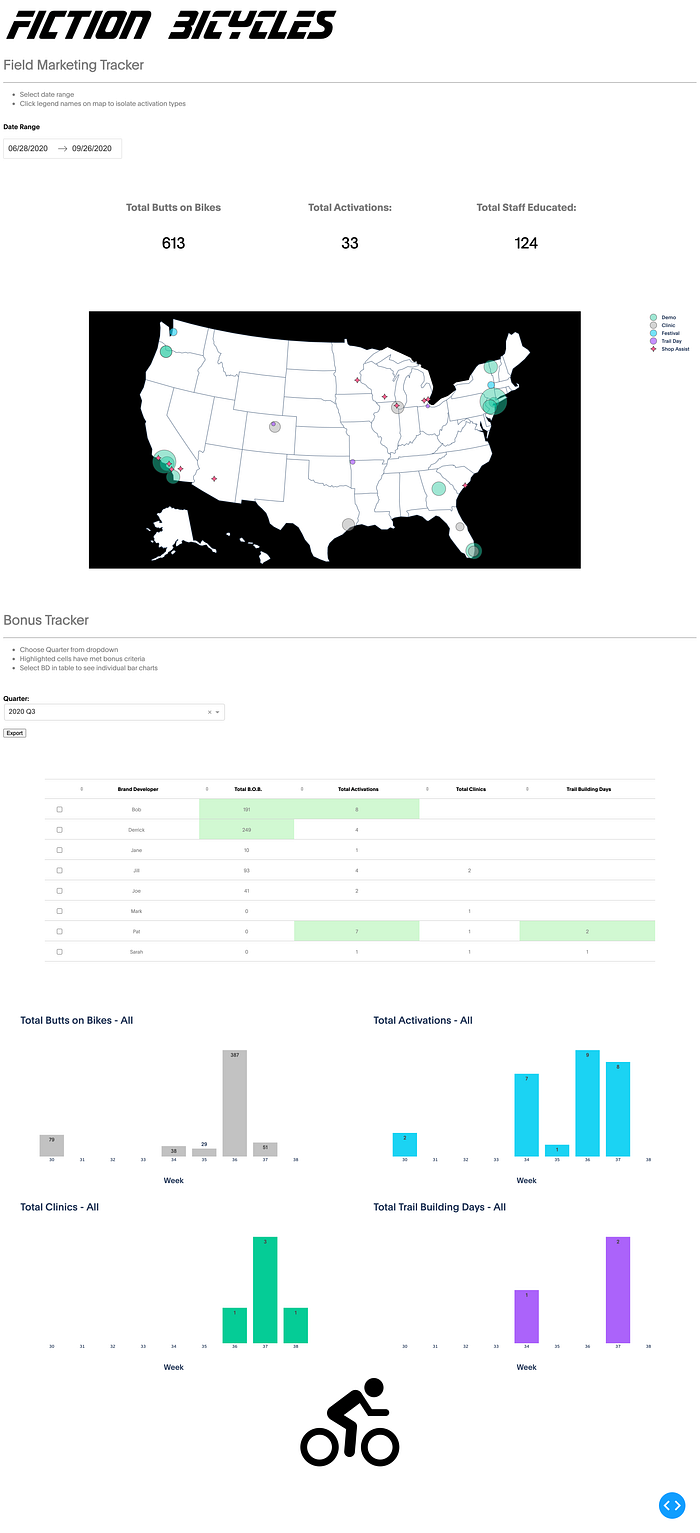
We’re going to build this:
Part 1 — Design and E.T.L. using Google and code.gs
Before beginning dashboard and any app, we must first make a list of the important elements we will need to build it.
- Filter by Date — We will want to allow the head of marketing to see activities in a specific date range
- Aggregated values — Each event has a quantifiable feature such as number of staff educated in a clinic or number of consumers who have test ridden a bicycle
- Map — A visual overview of the size and location of each event for the team to identify gaps in coverage
- Quarterly Date Range — Field marketing team earns a bonus by quarter, we will need to filter by this fixed date period
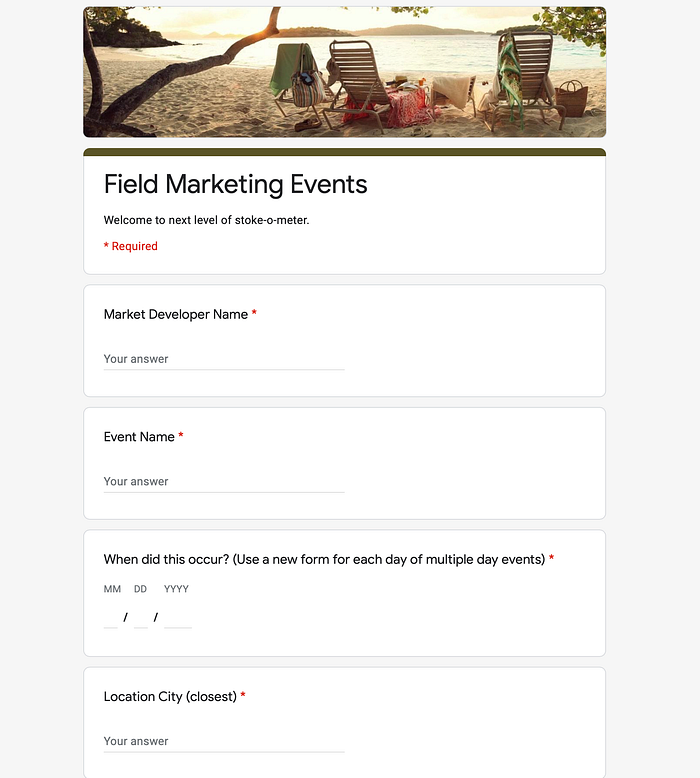
To build this project, we are going to create a simple Google Form. These are handy for surveys and quick data entry and they allow for data validation such as dates and required responses just like a typical SQL db. Further, Google Forms will store each response in a Google Sheet which will act as our data source for the Dashboard app.

GeoCode
Of the above requirements, nearly all can be handled natively in python fast enough to load an app. However, the best method to plot coordinates on a map in Plotly is to use latitude and longitude. I don’t want to complicate the data entry for the marketing team by asking them to look up these coordinates when submitting a Google Form. And at this point I could not find a pre-built Google form solution to incorporate maps to allow for a “Drop a Pin” solution (Perhaps my next project idea?). I discovered that converting an address into coordinates requires calling an API in python and I would like to avoid that while our dashboard is loading.
However, inside the Google suite of products, there is an internal API to make speedy calls for Longitude and Latitude. Next will write a script inside our new Google Sheet which will append the latitude and longitude to last column in the Google Sheet where the responses are stored.
code.gs
https://developers.google.com/apps-script/reference
Google Apps Script is a very robust tool that allows you to build script functions to perform tasks that don’t yet exist Google Sheets, Docs or Slides. The code.gs name is a clever twist on Node.js as the script language shares a lot with the look and feel of the javascript based language. This tool allows you to write custom functions into your spreadsheet (or ANY g-suite tool!) that can be used just like you use =SUM(A1:A5) in sheets. Or you could use it to connect to your Google Calendar to find meeting requests in a Google Doc. I don’t write in javascript and have really never seen much of the code, but some basic understanding of code can allow you to get something up and running.
The core of the Sheets scripting language is built on a few classes such as .sheet() or .range() or .cell() This allows the script to find specific information in the sheet, do some transform and return the new value to another specific location. Exactly what we are looking for.
Further, there are many many classes to use other Google services such as Maps.newGeocoder() in the Maps class. With this class we can use robust Google Maps service right in the script to call for our latitude and longitude from very basic city or zipcode data.
So, the first task to complete in order to prepare our data for the dashboard will be to run a script to insert the lat and lon.

With the help of this tutorial from Will Geary, I was able to create a function in code.gs that looks for an address and inserts the lat/lon coordinates:
If you are familiar with javascript you will likely find much cleaner or better way to write this code. In psuedo code, here is what this function does:
- Line 2: Get data from the specific spreadsheet. I had uncertainty as many of the docs I read and sample code snippets I found seemed to use a generic version of this line which only asked for “the current spreadsheet”. The idea is that the function was exclusively tied to the sheet from which I opened the script editor. Just to be safe, I have entered the exact ID of the sheet. I wouldn’t want this function accidentally writing data on another sheet in my Google drive. You can find the unique ID below:

- Start in Column G and check for data in the next row down. This will create a range of rows that contain data.
- Grab the block of cells from columns 2 through 7 in the length of the range we just found above to get the zip code from each row
- Loop through each cell and create a list of Lat/Lon data — Yes this cycles through the entire list each time the function runs, which is wasteful programing. However, I chose to keep this step in case someone makes a manual change to the data in the response form later and it is unlikely the data will ever be more than a thousand rows.
- Insert this list of data in the last column of the sheet. This does not include logic to check for the last column with data. It is explicitly told to go to column AB and AC. If revisions are made to the Google Form and questions are added, you will need to manually update this script.
The Logger.log is a great tool to test steps along the way and see that each varible is stored as it should be.
The Function Trigger
The last step in Part 1 of our dashboard build is to configure the trigger to which will run this script. Google has made this super simple. The standard choice is to run the script when the file is opened or the data has been changed, but this only recognizes user changes, not changes made by a Google Form or another script. Simple enough, Google has also set up a specific trigger event based on a Form submission.


Code.gs
Code.gs was a super cool tool to use here. It has so much potential and will help me in my actual job tremendously. If your company is already using the G-suite, work with your team’s existing processes and add a few custom functions to help them along the way as an mvp step. Many sales teams will be storing their information big spreadsheets for single clients or projects and want just a little data help. Connect sheets with map functionality or email or calendar.
Connecting Python to Google Docs API
Next we will look to connect our app directly to the real-time data in that Google Sheet.
Initial searches led me to the Google Docs Quickstart page. While it is thorough and works great for applications you might run in the command line, it will not work for our ultimate goal of hosting this app on Heroku.
A better solution is to use Google Service Accounts.
Thankfully, another Medium post from Denis Luiz perfectly explains what we will we need to do here.
I wouldn’t be able to write the process better than above link. Instead I’ll highlight the places I stumbled in the process and point out some slight deviations we will make for our app.
- Add your email — Perhaps I read too quickly through the tutorial, or I thought that becuase the my personal email was in charge of both the API and the Google Sheet that the permissions were already set. You need to add the special API email to the “Share” section of the Google Sheet just like you would invite a coworker to edit.

2. Install the Google Client Library — Like many data science projects, I am using Anaconda as a package manager. I always try to use it to manage dependancies and install with pip as a last option after the other packages have been installed. Thankfully the packages needed to connect to the Google API are also included in Anaconda conda install -c conda-forge google-api-python-client google-auth-httplib2 google-auth-oauthlibUltimately, The packages will be downloaded with pip when we get to the final step loading the app to Heroku, but while I am testing I like to use Anaconda.
3. Stringify the credentials — This is an important deviation from the Medium tutorial above if we are going to use the app with Heroku. Instead of the app looking for a credentials.json file in the current working directory, we are going to use set up an environment variable on our machine with the .json file as one big string and convert it to back to a json in our function.
This is to keep us from passing credentials file and potentially exposing it. Heroku has a built in system to pass environment variables like this to our app in exactly the same way our local system does.
For now, to test our project locally, we need to add these to .bashrc or .zshrc file. If you have not done this before: Great Tutorial here from 김영석
- Open the credentials file in your text editor, highlight and copy all of it (including the
{&}). - Open your .bashrc file and add the new environment variable wrapping the information you are about to paste in single quotes
'': export GDRIVE_AUTH='<paste your credentials here>'
4. Find the Sheet ID of the data you will want to connect to. Repeat the steps above to create an environment variable for it as well.

export SPREADSHEET_ID='<paste your unique ID here>'
5. Last one, add the specific range you will need data from on your Sheet as an environment variable
export RANGE_NAME='Form Responses 1!A1:AF'
Go get the data
The first task in our Python code will be to call the Google Sheet API and create a Pandas DataFrame with the latest values.
Pandas will allow us to do vast amount of manipulations on the data before creating charts and visuals, and will do that at speeds quick enough for this webpage.
This function requires the three global variables we just mentioned to be defined about what the Google Sheet API should be looking for. In the final Dash App script we will define these ahead of the function above.
SPREADSHEET_ID = <the unique code from the URL of the Sheet>RANGE_NAME = <The name of the tab and range to look for>CREDS = The stringified version of our Google API Credentials above
Next, we add a simple function to convert the values from the spreadsheet into a Pandas DataFrame.
Now we are ready to create a Plotly Dash App with the resulting data.
Conclusion
Here we have completed the first part of building our Dashboard. We now have a process to get the latest data from our data store before we build a few visualizations and deploy the app to Heroku.
Part 2:
Build a Plotly Dash app


