Beeralytics — A Guide to Analyzing Beer Prices from Web Data
Using Bokeh to find the best priced Beers on Delivery Sites
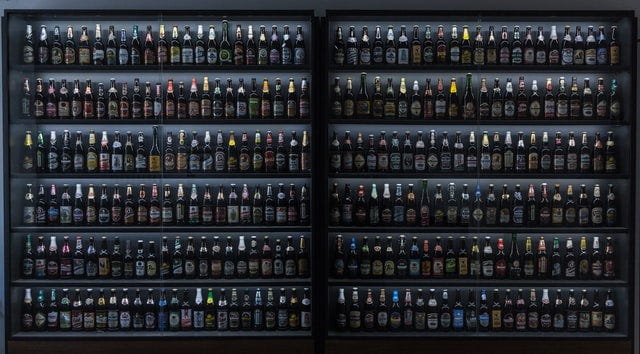
A few weeks ago my girlfriend and I were having drinks at a bar and started debating what the cheapest beer on the menu was. The challenge itself was that there were multiple sizes and alcohol content across 20-or-so beers which made simple comparisons a challenge. Bets were made, and we started doing cell phone math (I swear we’re this exciting all the time) using a basic formula to normalize them:
‘Oz. of alcohol per $’ = ((‘Total Oz.’ * ‘Alcohol %’) / 100) / Price
This revealed that the high ABV IPAs were the most value for your money by a decent margin! Now that I had lost yet another betting game to my girlfriend I was curious as to whether this was a local choice (maybe the bar had trouble moving those kinds of drinks) or was this kind of pricing consistent at scale? This seemed like a fun data science problem, so I started brainstorming ways in which to answer this question.
A decade ago, this probably wouldn’t be possible without proprietary datasets or visiting each individual store and writing down all the pricing (I’m sure store owners love that). Instead we now have a plethora of delivery services like Drizly and Minibar that act as an aggregator by…


