Baffling Concept of True Positive and True Negative
Understanding TP/TN and FP/FN

In machine learning and statistics, we use the term true positive and true negative very commonly but still people get confused and therefore their matrix is known as confusion matrix. Now the question arises what is true and false moreover, what is positive and negative. We can read definitions and can be more puzzled. So, in easy words, we will understand.
What is Positive and Negative?
Positive and negative are nothing but just two classes, for example, survived/not survived, cancer/not cancer, credit card fraud/not fraud, spam/not spam, etc. It’s not only in between two happen/not happen, but it can also be divided into cat/dog, male/female. So, one class we consider as positive and other as negative. It’s arbitrary or depend on the objective of the study to which you take one as a positive and other as a negative. There is no good (positive) or bad (negative) aspect in it.
What is True and False?
When there is a sample data from some population and we use modeling through which we can predict its class/labels. The “true” represents the records that the model was able to identify its class, whereas “false” represents the records that the model was not able to identify.
Confusion Matrix
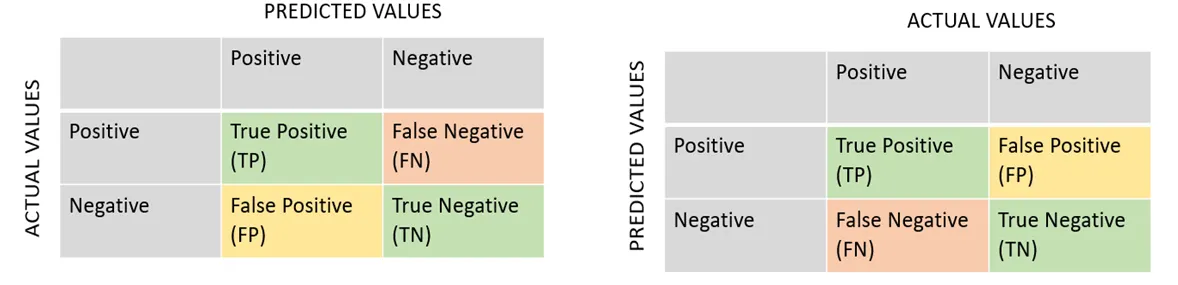
A confusion matrix is a table that represents the summary of the prediction results on a classification problem. We can see below a confusion matrix. The position of the predicted values and actual values changes the position of False negative (FN) and False positive (FP) but True positive (TP) and True negative (TN) remains in the same place in the matrix placed diagonally to each other. But because of this, the situation becomes confusing.
Simple examples to better understand the concept. In this example, there are two classes of fruits. We had 9 apples and 10 strawberries, but the model identified only 6 apples (true positive) and 8 strawberries (true negative) correctly, moreover, the model predicted 2 strawberries as apple (false positive) and 3 apples (false negative) as strawberries. In the other example, pregnant/not pregnant are two classes. There are 8 women pregnant and 8 women not pregnant, the model classified 6 pregnant (true positive) and 5 not pregnant (true negative) women correctly, but 3 not pregnant (false positive) women as pregnant and 2 pregnant (false negative) women as not pregnant.

By below GIF, one can understand the concept more clearly.

Performance evaluation Measures
From confusion matrix, we can also calculate the model’s accuracy, precision recall and F1 score. These measures help to understand the model’s performance. From the formulae, we can calculate these measures and for calculating we can use confusion matrix. The formulae are given below in the matrices. Here NPV is negative predicted value. As discussed above, as the position of actual and predicted value changes, the position of measures changes too.
Definitions in simpler terms:
Accuracy: Accuracy is the ratio of the records that the model correctly classified over the total number of records. For example, if there are 10 red balls and 10 purple balls, 8 red and 7 purple balls you identified correctly, then your accuracy is 8+7/20=0.75 and hence, accuracy is 75%.
Precision: Precision is the ratio of the positives that are correctly identified by the model over total positive records. For example, if there are 10 red balls and 10 purple balls, one has to identify which are red balls and for any reason you recognized 8 red balls and 2 purple balls as “red balls” then your precision is 8/10, i.e., 80%.
Sensitivity: the ability of a test to correctly identify true positives (people who have the disease and model identified it so).
Specificity: the ability of a test to correctly identify true negatives (people who don’t have the disease and model identified it so).
F1 score: The F1 score is a weighted average of the precision and recall/sensitivity, with a best score at 1 and worst score at 0. The formula is as below.


Python Codes
We can build these confusion matrices and even calculate these measures easily using Python. The data used is taken from UCI inventory “https://archive.ics.uci.edu/ml/datasets/Heart+failure+clinical+records”. The codes are as follows:
Sklearn.metrics offers different options to make confusion matrix, first just to display numbers an option is confusion_matrix which gives matrix as below.

Moreover, to plot the confusion matrix, sklearn.metrics has two options, i.e., ConfusionMatrixDisplay and plot_confusion_matrix. Mostly plot_confusion_matrix is used as one can also get the normalize confusion matrix plot only with option normalize as ‘true’.


We can also use python Seaborn’s heatmap to make the confusion matrix as below, ‘annot’ option keeping false removes numbers inside the matrix.

Below are the codes to get the accuracy, recall, F1 score, precision, roc auc score (compute Area Under the Receiver Operating Characteristic Curve (ROC AUC) from prediction scores).


Though there are some simple options for creating a confusion matrix and calculating evaluation measures, it is better for us to comprehend the concepts and formulae, so that we can understand and explain the analyses.
Thanks for reading!
References:
https://scikit-learn.org/stable/modules/classes.html#module-sklearn.metrics